(1)
| The shares described as "owned" are shares of our common stock directly or indirectly owned by each listed person, including shares held in 401(k) and Employee Stock Ownership Plans, and by members of his or her household, and are held individually, jointly or pursuant to a trust arrangement. Mr. Prince disclaims beneficial ownership of 800 shares listed as owned by him. | |
2023 total Director compensation This table sets forth the compensation of our Directors for fiscal 2023. For a complete understanding of the table, please read the accompanying footnotes and the narrative disclosures. | | | | | | | | | | | | | | | | | | | | | | | | | | | | | | | A | B | C | D | E | F | | Name | Role for additional cash retainer | Fees earned or paid in cash | Stock awards | All other compensation | | Total | | D. Adamczyk | | | $125,000 | | $195,000 | | $20,000 | | $340,000 | | M. C. Beckerle | Comm Chair | | 145,000 | | 195,000 | | 15,000 | | 355,000 | | D. S. Davis | Comm Chair | | 155,000 | | 195,000 | | 0 | | 350,000 | | I. E. L. Davis | | | 72,688 | | 0 | | 0 | | 72,688 | | J. A. Doudna | | | 125,000 | | 195,000 | | 0 | | 320,000 | | M. A. Hewson | Comm Chair | | 145,000 | | 195,000 | | 20,000 | | 360,000 | | P. A. Johnson | | | 109,503 | | 233,466 | | 10,000 | | 352,969 | | H. Joly | | | 125,000 | | 195,000 | | 0 | | 320,000 | | M. B. McClellan | | | 125,000 | | 195,000 | | 0 | | 320,000 | | A. M. Mulcahy | LD/Comm Chair | | 195,000 | | 195,000 | | 20,000 | | 410,000 | | A. E. Washington | | | 105,154 | | 0 | | 0 | | 105,154 | | M. A. Weinberger | Comm Chair | | 145,000 | | 195,000 | | 0 | | 340,000 | | N. Y. West | | | 125,000 | | 195,000 | | 20,000 | | 340,000 | | E. A. Woods | | | 10,616 | | 78,534 | | 0 | | 89,150 |
Fees earned or paid in cash (Column C) Elective fee deferrals. As described below, under the Deferred Fee Plan for Directors, non-employee Directors may elect to defer payment of all or a portion of their cash retainers until termination of Board membership. Ms. Hewson, Dr. Washington and Mr. Woods elected to defer all of the cash retainer earned by each of them during fiscal 2023. Stock awards (Column D) For the non-employee Directors: Deferred Share Units - mandatory deferral. All figures in column D represent the grant-date fair value computed in accordance with FASB ASC Topic 718 of Deferred Share Units (DSUs) granted to each non-employee Director on April 27, 2023. The Board approved a 2023 DSU award valued at $195,000; therefore, pursuant to the terms of the Deferred Fee Plan for Directors, each non-employee Director (other than Dr. Johnson, Mr. I. E. L. Davis, Dr. Washington and Mr. Woods) was granted 1,193.975 DSUs. Dr. Johnson was granted 1,429.5 DSUs to account for two additional months of service in 2023. Mr. I. E. L. Davis and Dr. Washington received a one-time cash payment equal to the pro rata amount of the equity award for fiscal year 2023. The pro rata fees and awards earned related to Mr. Woods' time served in 2023 are included in the chart above and the related DSUs will be credited to his account in the first quarter of 2024. DSUs are immediately vested but must be deferred until termination of Board membership. DSUs earn additional amounts based on a hypothetical investment in our common stock, including accruing dividend equivalents in the same amount and at the same time as dividends paid on our common stock. DSUs are settled in cash upon termination of Board membership. All other compensation (Column E) For the non-employee Directors: charitable matching contributions. The amounts reported in column E represent the aggregate dollar amount for each non-employee Director for charitable matching contributions. Non-employee Directors are eligible to participate in our charitable matching gift program on the same basis as employees, pursuant to which we contribute, on a two-to-one basis for every dollar donated, up to $20,000 per year per person to certain charitable institutions. (2) | | | | | | | 50 | | Includes Deferred Share Units credited to non-employee Directors under our Amended and Restated Deferred Fee Plan for Directors and Deferred Share Units credited to the executive officers under our Executive Income Deferral Plan (Amended and Restated). |
| | (3)
| Includes shares underlying options exercisable on February 27, 2018, options that become exercisable within 60 days thereafter and Restricted Share Units that vest within 60 days thereafter. |
Director compensation policies and practices Deferred fee plan for Directors Elective fee deferrals. Under the Deferred Fee Plan for Directors, non-employee Directors may elect to defer payment of all or a portion of their cash retainers until termination of Board membership. Deferred fees are converted into DSUs and earn additional amounts based on a hypothetical investment in our common stock, including accruing dividend equivalents in the same amount and at the same time as dividends paid on our common stock. DSUs are settled in cash upon termination of Board membership. Ms. Hewson, Dr. Washington and Mr. Woods elected to defer all of the cash retainer earned by each of them during fiscal 2023. All DSUs earned by Mr. Woods in 2023 will be credited to his account in the first quarter of 2024. Deferred compensation balances. At December 31, 2023, the aggregate number of DSUs held in each non-employee Director’s Deferred Fee Account, including mandatory deferrals, any elective fee deferrals and accrued dividend equivalents, was as follows: | | | | | | | Name | Deferred share units
(#) | | D. Adamczyk | 2,309 | | M. C. Beckerle | 12,166 | | D. S. Davis | 14,112 | | J. A. Doudna | 6,646 | | M. A. Hewson | 8,489 | | P. A. Johnson | 1,461 | | H. Joly | 5,040 | | M. B. McClellan | 16,360 | | A. M. Mulcahy | 19,936 | | M. A. Weinberger | 7,686 | | N. Y. West | 3,680 | | E. A. Woods | 0 |
Additional arrangements We pay for or reimburse Directors for transportation, hotel, food and other incidental expenses related to attending Board and committee meetings, director orientation or other relevant educational programs or Company meetings.
Stock ownership guidelines for non-employee Directors Our stock ownership guidelines for non-employee Directors are intended to further align the Directors' interests with the interests of our shareholders. Stock ownership for the purpose of these guidelines includes shares directly owned by the Director, shares held indirectly that are beneficially owned by the Director and DSUs. All Directors are prohibited from transacting in derivative instruments linked to the performance of our securities. 2018 Proxy Statement - 35 | | | | | | | | | | | | | | | | Name | Stock ownership guideline
as a multiple of annual
cash retainer | 2023 Compliance
with stock ownership guidelines? | Ownership threshold met?(1) | | D. Adamczyk | 5x | Yes | No | (2) | | M. C. Beckerle | 5x | Yes | Yes | | | D. S. Davis | 5x | Yes | Yes | | | I. E. L. Davis | 5x | Yes | Yes | | | J. A. Doudna | 5x | Yes | Yes | | | M. A. Hewson | 5x | Yes | Yes | | | P. A. Johnson | 5x | Yes | No | (2) | | H. Joly | 5x | Yes | Yes | | | M. B. McClellan | 5x | Yes | Yes | | | A. M. Mulcahy | 5x | Yes | Yes | | | A. E. Washington | 5x | Yes | Yes | | | M. A. Weinberger | 5x | Yes | Yes | | | N.Y. West | 5x | Yes | No | (2) | | E. A. Woods | 5x | Yes | No | (2) |
(1)Non-employee Directors have five years after first becoming subject to the guidelines to achieve the required ownership threshold. (2)Joined Board within past five years. Stock ownership information Security ownership of certain beneficial owners, officers and Directors This table sets forth information regarding beneficial ownership of our common stock by each Director, our Chairman and CEO, Chief Financial Officer and the three other most highly compensated executive officers named in Executive Compensation Tables on pages 89 through 121 (each a named executive officer) and by all Directors and executive officers as a group. Each of the individuals/group listed below is the owner of less than 1% of our outstanding shares. Because they serve as trustees of Johnson Family Trusts, which hold stock for the benefit of others, Mr. Duato and Mr. Wolk are deemed to “control” an additional 5,063,615 shares of our stock in which they have no economic interest, and those shares are not reflected in this table. In addition to such shares, the Directors and executive officers as a group own/control a total of 901,607 shares. In the aggregate, these 5,965,222 shares represent less than 1% of the shares outstanding. All stock ownership is as of February 27, 2024.
Beneficial ownership table | | | | | | | | | | | | | | | | Name | Number of common shares(1) (#) | Deferred share units(2) (#) | Common shares underlying options or stock units(3) (#) | Total number of shares beneficially owned(5) (#) | | D. Adamczyk | 1,063 | 2,309 | 0 | 3,372 | | M. C. Beckerle | 0 | 12,166 | 0 | 12,166 | | D. S. Davis | 0 | 14,112 | 0 | 14,112 | | J. A. Doudna | 0 | 6,646 | 0 | 6,646 | | J. Duato | 364,185 | 0 | 897,368 | 1,261,553 | | P. Fasolo | 112,076 | 0 | 198,009 | 310,085 | | M. A. Hewson | 3,000 | 8,489 | 0 | 11,489 | | P. A. Johnson | 202 | 1,461 | 0 | 1,663 | | H. Joly | 5,000 | 5,040 | 0 | 10,040 | | M. B. McClellan | 0 | 16,360 | 0 | 16,360 | | A. M. Mulcahy | 8,098 | 19,936 | 0 | 28,034 | | J. Reed | 306 | 0 | 0 | 306 | | J. Taubert | 154,851 | 0 | 464,471 | 619,322 | | M. A. Weinberger | 0 | 7,686 | 0 | 7,686 | | N. Y. West | 0 | 3,680 | 0 | 3,680 | | J. Wolk | 70,938 | 0 | 326,168 | 397,106 | | E. A. Woods | 0 | 0 | 0 | 0 | A. McEvoy(4) | 55,191 | 0 | 354,651 | 409,842 | All Directors and executive officers as a group (23)(4) | 901,607 | 97,885 | 2,769,299 | 3,768,791 |
(1)The shares described as owned are shares of our common stock directly or indirectly owned by each listed person, including shares held in the 401(k) and Employee Stock Ownership Plans and by members of his or her household, and are held individually, jointly or pursuant to a trust arrangement. (2)Includes Deferred Share Units credited to non-employee Directors under our Amended and Restated Deferred Fee Plan for Directors and Deferred Share Units credited to the executive officers under our Executive Income Deferral Plan (Amended and Restated), if any. (3)Includes shares underlying options exercisable on February 27, 2024, options that become exercisable within 60 days thereafter and Restricted Share Units that vest within 60 days thereafter. (4)The aggregate holdings do not include Ms. McEvoy as she was no longer an executive officer, effective October 20, 2023. Ms. McEvoy's holdings are as of October 20, 2023. (5)Information regarding stock ownership guidelines for named executive officers is found on page 84 and at www.investor.jnj.com/governance/corporate-governance-overview.
The following are the only persons known to us to be the beneficial owners of more than five percent of any class of our voting securities: | | | | | | | | | | | | | Name and address of beneficial owner | Title of class | Amount and nature
of beneficial
ownership | Percent of class | The Vanguard Group 100 Vanguard Boulevard Malvern, PA 19355 | Common stock | 229,372,559 shares(1) | 9.53%(1) | BlackRock, Inc. 55 East 52nd Street New York, NY 10055 | Common stock | 186,308,341 shares(2) | 7.7%(2) | State Street Corporation State Street Financial Center One Lincoln Street Boston, MA 02111 | Common stock | 132,996,283 shares(3) | 5.52%(3) |
(1)Based solely on an Amendment to Schedule 13G filed with the SEC on February 13, 2024, The Vanguard Group (Vanguard) reported aggregate beneficial ownership of approximately 9.53%, or 229,372,559 shares, of our common stock as of December 29, 2023. Vanguard reported that it possessed sole dispositive power of 219,263,309 shares, shared dispositive power of 10,109,250 shares and shared voting power of 2,806,101 shares. Vanguard also reported that it did not possess sole voting power over any shares beneficially owned. (2)Based solely on an Amendment to Schedule 13G filed with the SEC on January 26, 2024, BlackRock, Inc. (Black Rock) reported aggregate beneficial ownership of approximately 7.7%, or 186,308,341 shares, of our common stock as of December 31, 2023. BlackRock reported that it possessed sole voting power of 168,179,492 shares and sole dispositive power of 186,308,341 shares. BlackRock also reported that it did not possess shared voting or dispositive power over any shares beneficially owned. (3)Based solely on a Schedule 13G filed with the SEC on January 30, 2024, State Street Corporation (State Street) reported aggregate beneficial ownership of approximately 5.52%, or 132,996,283 shares, of our common stock as of December 31, 2023. State Street reported that it possessed shared voting power of 84,902,678 shares and shared dispositive power of 132,904,295 shares. State Street also reported that it did not possess sole voting or sole dispositive power over any shares beneficially owned. As a result of being beneficial owners of more than 5% of our stock, Vanguard, BlackRock and State Street are currently considered related persons under our Policy on Transactions with Related Persons described on page 46. •Certain of our U.S. and international employee savings and retirement plans and other affiliates have retained BlackRock and its affiliates to provide investment management services. In connection with these services, we paid BlackRock approximately $2.9 million in fees during fiscal year 2023. •Certain of our U.S. and international employee savings and retirement plans and other affiliates have retained State Street and its affiliates to provide investment management, trustee, custodial, administrative and ancillary investment services. In connection with these services, we paid State Street approximately $11.2 million in fees during fiscal year 2023. Delinquent Section 16(a) reporting The Forms 4 filed on May 2, 2023 were filed one day late for the following individuals: Mr. Adamczyk, Dr. Beckerle, Dr. Doudna, Mr. D. S. Davis, Ms. Hewson, Dr. Johnson, Mr. Joly, Dr. McClellan, Ms. Mulcahy, Mr. Weinberger and Dr. West.
| | | | | Name and Address of Beneficial Owner | Title of Class | Compensation of executives Amount and Nature
of Beneficial
Ownership
| | | | | | | | | | | | | | | | | | | Percent of Class The Vanguard Group
100 Vanguard Boulevard
Malvern, PA 19355
| Common Stock | 204,466,526 shares(1)
| 7.61%(1)
| BlackRock Inc.
55 East 52nd Street
New York, NY 10055
| Common Stock | 167,535,883 shares(2)
| 6.2%(2)
| State Street Corporation
State Street Financial Center
One Lincoln Street
Boston, MA 02111
| Common Stock | 156,126,923 shares(3)
| 5.81%(3)
| (1) Based solely on an Amendment to Schedule 13G filed with the SEC on February 9, 2018, The Vanguard Group reported aggregate beneficial ownership of approximately 7.61%, or 204,466,526 shares, of our common stock as of December 31, 2017. Vanguard reported that it possessed sole dispositive power of 200,188,755 shares, sole voting power of 3,781,587 shares, shared dispositive power of 4,277,771 shares, and shared voting power of 593,263 shares.
| (2) Based solely on an Amendment to Schedule 13G filed with the SEC on February 8, 2018, BlackRock, Inc. reported aggregate beneficial ownership of approximately 6.2%, or 167,535,883 shares, of our common stock as of December 31, 2017. BlackRock reported that it possessed sole voting power of 143,538,105 shares and sole dispositive power of 167,535,883 shares. BlackRock also reported that it did not possess shared voting or dispositive power over any shares beneficially owned.
| (3) Based solely on a Schedule 13G filed with the SEC on February 14, 2018, State Street Corporation reported aggregate beneficial ownership of approximately 5.81%, or 156,126,923 shares, of our common stock as of December 31, 2017. State Street reported that it possessed shared voting power of 148,782,523 shares, shared dispositive power of 156,126,923 shares, sole voting power of 7,344,400 shares. State Street also reported that it did not possess sole dispositive power over any shares beneficially owned.
| As a result of being beneficial owners of more than 5% of our stock, The Vanguard Group (Vanguard), BlackRock, Inc. (BlackRock), and State Street Corporation (State Street) are currently considered “related persons” under our Policy on Transactions with Related Persons described on page 33 of this Proxy Statement. |
| 2 | Advisory vote to approve named executive officer compensation | | | | | | | | | | | | | | | CertainWe believe our executive compensation programs promote long-term, sustainable value creation and are strongly aligned with the long-term interests of our U.S. and international employee savings and retirement plans have retained BlackRock and its affiliates to provide investment management services. In connection with these services, we paid BlackRock approximately $2.6 million in fees during fiscal year 2017.
Certainshareholders. The guiding principles of our U.S. and international employee savings and retirement plans and other affiliates have retained State Street and its affiliates to provide investment management, trustee, custodial, administrative and ancillary investment services. In connection with these services, we paid State Street approximately $8 million in fees during fiscal year 2017.
Section 16(a) Beneficial Ownership Reporting Compliance
Based on our review of Forms 3, 4 and 5 and amendments thereto in our possession and written representations furnished to us, we believe that during 2017 all reports for our executive officers and Directors that were requiredcompensation program continue to be filed under Section 16pay for performance, accountability for short-term and long-term performance, alignment with shareholders’ interests and market competitiveness.
We assess performance by reviewing not only what financial and strategic objectives were achieved but also how those results were achieved and whether they were achieved consistent with the values embodied in Our Credo. As an advisory vote, the results of the Securities Exchange Act of 1934 were filed on a timely basis, except for nine reports, each in respect of three transactions filed by each of the following officers: J. Duato, P. Fasolo, A. Gorsky, R. A. Kapusta, J. S. Mesquita, S. E. Peterson, G. J. Pruden, P. Stoffels, and M. H. Ullmann. In each case, the company made such filings on behalf of the applicable officer and believed that such filings had been made in a timely manner, but technical errors delayed acceptance of the filings by the SEC until 6 a.m.this vote will not be binding on the morning followingBoard or the company’s transmission.
| | | | 2018 Proxy Statement - 36
| | |
DIRECTOR COMPENSATION
OurCompany. However, the Board and the Compensation & Benefits Committee is required by its charter to annually review non-employee Director compensation, including total compensation and each element of our non-employee Director compensation program. | | During its annual review, the Compensation & Benefits Committee analyzes the competitive position of our non-employee Director compensation program and each element of that program against the programs of the peer group used for executive compensation purposes (see page 61 for information about the Executive Peer Group). Frederic W. Cook & Co., Inc., the Committee’s independent consultant, provides an independent assessment of the competitive data provided to the Committee and advises the Committee on non-employee Director compensation. Decisions regarding the non-employee Director compensation program are approved by our full Board of Directors, based on recommendations by our Compensation & Benefits Committee. |
Fiscal 2017 Non-Employee Director Compensation
The Compensation & Benefits Committee’s analysis in 2016 ofvalue the competitive position of our non-employee Director compensation program showed that overall compensation for non-employee Directors and the retainer for the Lead Director were below the peer group median. As a result, our Compensation & Benefits Committee recommended, and our Board of Directors approved on September 13, 2016, the following non-employee Director compensation program for 2017 to achieve an overall compensation structure in line with the peer group median.
| | | 2017 Non-Employee Director Compensation(1)
| ($) | Cash Compensation | $110,000 | Lead Director Cash Retainer | 35,000 | Audit Committee Chair Cash Retainer | 25,000 | Committee Chair (other than Audit) Cash Retainer | 20,000 | Value of Deferred Share Units | 175,000 |
| | (1)
| See columns C and D of the table below |
The compensation of our non-employee Directors for fiscal 2017 is set forth in the following table. Mr. Gorsky is an employee of the company, and therefore, received no additional compensation for his service as a Director. For a complete understanding of the table, please read the accompanying footnotes and the narrative disclosures.
| | | | | | | | 2017 Total Non-Employee Director Compensation | | | | | A | B | C | D | E | F | | Name | Role for Additional Cash Retainer | Fees Earned or Paid in Cash ($) | Stock Awards (DSUs) ($) | All Other Compensation ($) | Total ($) | | M. C. Beckerle | Committee Chair | $130,000 | $174,893 | $20,000 | $324,893 | | D. S. Davis | Audit Committee Chair | 135,000 | 174,893 | 0 | 309,893 | | I. E. L. Davis | | 110,000 | 174,893 | 0 | 284,893 | | M. B. McClellan | | 110,000 | 174,893 | 0 | 284,893 | | A. M. Mulcahy | Lead Director | 145,000 | 174,893 | 0 | 319,893 | | W. D. Perez | Committee Chair | 130,000 | 174,893 | 20,000 | 324,893 | | C. Prince | Committee Chair | 130,000 | 174,893 | 20,000 | 324,893 | | A. E. Washington | | 110,000 | 174,893 | 0 | 284,893 | | R. A. Williams | Committee Chair | 130,000 | 174,893 | 20,000 | 324,893 |
| | | | | | 2018 Proxy Statement - 37
|
Stock Awards (Column D)
Deferred Share Units - Mandatory Deferral. All figures in column D represent the grant date fair value of Deferred Share Units (DSUs) granted to each non-employee Director on February 14, 2017. The Board approved a 2017 DSU award valued at $175,000; therefore, pursuant to the terms of the Deferred Fee Plan for Directors, each non-employee Director was granted 1,512 DSUs (rounded down to the nearest whole share). DSUs are immediately vested but must be deferred until the Director completes service as a Board member. DSUs earn additional amounts based on a hypothetical investment in our common stock, including accruing dividend equivalents in the same amount and at the same time as dividends paid on our common stock. DSUs are settled in cash upon termination of Board membership.
All Other Compensation (Column E)
Charitable Matching Contributions. The amounts reported in column E represent the aggregate dollar amount for each non-employee Director for charitable matching contributions. Non-employee Directors are eligible to participate in our charitable matching gift program on the same basis as employees, pursuant to which we contribute, on a two-to-one basis for every dollar donated, up to $20,000 per year per person to certain charitable institutions.
Deferred Fee Plan for Directors
Elective Fee Deferrals.Under the Deferred Fee Plan for Directors, non-employee Directors may elect to defer payment of all or a portion of their cash retainers until termination of Board membership. Deferred fees are converted into DSUs, and earn additional amounts based on a hypothetical investment in our common stock, including accruing dividend equivalents in the same amount and at the same time as dividends paid on our common stock. DSUs are settled in cash upon termination of Board membership. In 2017, Dr. Washington and Messrs. Perez and Williams elected to defer all of their cash 2017 retainers.
Deferred Compensation Balances. At December 31, 2017, the aggregate number of DSUs held in each non-employee Director’s Deferred Fee Account, including both mandatory deferrals and any elective fee deferrals, as well as dividend equivalent accruals, was as follows:
| | | Name | Deferred
Share Units
(#)
| M. C. Beckerle | 3,267 | D. S. Davis | 4,922 | I. E. L. Davis | 9,876 | M. B. McClellan | 6,834 | A. M. Mulcahy | 9,876 | W. D. Perez | 20,831 | C. Prince | 16,275 | A. E. Washington | 14,873 | R. A. Williams | 16,049 |
Additional Arrangements
We pay for or provide (or reimburse Directors for out-of-pocket costs incurred for) transportation, hotel, food and other incidental expenses related to attending Board and Committee meetings and Director orientation or other relevant educational programs or company meetings.
| | | | 2018 Proxy Statement - 38
| | |
Stock Ownership Guidelines for Non-Employee Directors
The company’s stock ownership guidelines for non-employee Directors are intended to further align the Directors' interests with the interestsopinions of our shareholders. Stock ownership for the purpose of these guidelines includes shares directly owned by the Director, shares held indirectly that are beneficially owned by the Director, and DSUs. Non-employee Directors are prohibited from transacting in derivative instruments linked to the performance of our securities.
| | | | | Name | Stock Ownership Guideline as a Multiple of Annual Cash Retainer | 2017 Compliance with Stock Ownership Guidelines? | Ownership Threshold Met?(1)
| M. C. Beckerle(2)
| 5x | Yes | No | D. S. Davis | 5x | Yes | Yes | I. E. L. Davis | 5x | Yes | Yes | M. B. McClellan | 5x | Yes | Yes | A. M. Mulcahy | 5x | Yes | Yes | W. D. Perez | 5x | Yes | Yes | C. Prince | 5x | Yes | Yes | A. E. Washington | 5x | Yes | Yes | R. A. Williams | 5x | Yes | Yes | (1) Non-employee Directors have five years after first becoming subject to the guidelines to achieve the required ownership threshold
(2) Joined Board within past five years. As of February 2018, now meets ownership threshold
|
Fiscal 2018 Non-Employee Director Compensation
The Compensation & Benefits Committee’s analysis in 2017 of the competitive position of our non-employee Director compensation program showed that overall compensation for non-employee Directors and the retainer for the Lead Director were below the peer group median. As a result, our Compensation & Benefits Committee recommended, and our Board of Directors approved on September 12, 2017, the following non-employee Director compensation program for 2018 to achieve an overall compensation structure in line with the peer group median:
| | | 2018 Non-Employee Director Compensation | ($) | Cash Compensation(1)
| $115,000 | Lead Director Cash Retainer | 35,000 | Audit Committee Chair Cash Retainer | 25,000 | Committee Chair (other than Audit) Cash Retainer | 20,000 | Value of Deferred Share Units(2)
| 185,000 | (1) Increase of $5,000
(2) Increase of $10,000
| |
| | | | | | 2018 Proxy Statement - 39
|
| | | | Item 2: Advisory Vote to Approve
Named Executive Officer Compensation
|
Before you vote, we urge you to read the following for additional details on our executive compensation
l Compensation Discussion and Analysis on pages 42 to 67
l Executive Compensation Tables on pages 68 to 85
| |
The Board of Directors recommends that shareholders vote, in an advisory manner, FOR approval of the compensation of our named executive officers and the executive compensation philosophy, policies and procedures described in the Compensation Discussion and Analysis (CD&A) section of the 2018 Proxy Statement.
| | When casting your 2018 “Say on Pay” vote, we encourage you to consider:
•
The alignment of the 2017 compensation of our Chairman/CEO and our other named executive officers with our company’s 2017 performance•
The pay-for-performance alignment built into the design of our incentive programs•
Our continued evaluation of our executive compensation program•
Our continued direct engagement with our shareholders | | | | We recognize that executive compensation is an important matter for our shareholders. We believe our compensation programs are strongly aligned with the long-term interests of our shareholders.
The guiding principles of our executive compensation program continue to be:
•
Accountability for Short-Term and Long-Term Performance; and•
Alignment to Shareholders’ Interests.Above all, we assess performance by reviewing not only what financial and strategic objectives are achieved but also how those results were achieved and whether they were achieved consistent with the values embodied in Our Credo.
As an advisory vote, the results of this vote will not be binding on the Board or the company. However, the Board of Directors values the opinions of our shareholders, andThey will consider the outcome of the vote when making future decisions on the compensation of our named executive officers and our executive compensation philosophy, policies and procedures.
Following our 2018 shareholder meeting on April 26, 2018 the next advisory vote on executive compensation is expected to occur at the 2019 Annual Meeting of Shareholders, unless the Board of Directors modifies its policy on the frequency of holding such advisory votes.
|
| | | | 2018 Proxy Statement - 40
| | |
| | Compensation Committee Report
The Compensation & Benefits Committee of the Board of Directors (the Committee) has reviewed and discussed the section of this Proxy Statement entitled “Compensation Discussion and Analysis” with management. Based on this review and discussion, the Committee has recommended to the Board that the section entitled “Compensation Discussion and Analysis,” as it appears on pages 42 through 67, be included in this Proxy Statement and incorporated by reference into the company’s Annual Report on Form 10-K for the fiscal year ended December 31, 2017.
Ronald A. Williams, Chairman
D. Scott Davis
A. Eugene Washington
|
| | | | | | 2018 Proxy Statement - 41
|
Compensation Discussion and Analysis
| | | | 2018 Proxy Statement - 42
| | |
2017 Performance and Compensation
| | | | | | | | | | Our Credo | | When we assess performance, we review not only what results were achieved but also how they were achieved and whether they were achieved consistent with the values embodied in Our Credo. In 2017, we upheld our Credo values by focusing on the needs and well-being of: our patients, consumers, and health care professionals who use our products; our employees; the communities in which we live and work; and our shareholders. | | | | | | | | | | Company Performance | | We delivered solid performance in 2017. We largely met or exceeded our combined financial and strategic goals. This was driven by strong performance in our Pharmaceutical business. We made good progress on many important strategic initiatives that will benefit our company in future years.
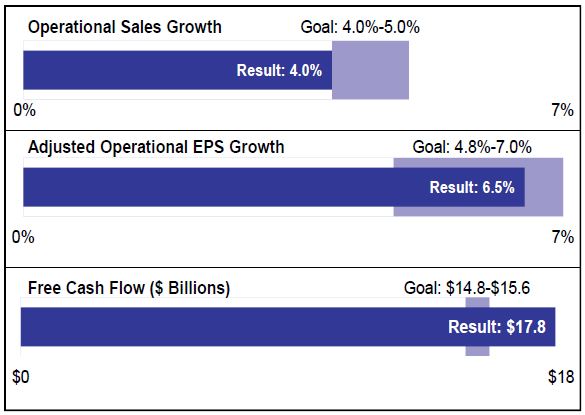
| | | Financial Goal | Goal | Results | | | | Met our operational sales growth goal | 4.0% - 5.0% | 4.0% | | | | Met our adjusted operational EPS growth goal | 4.8% - 7.0% | 6.5% | | | | Exceeded our free cash flow goal ($ Billions) | $14.8 - $15.6 | $17.8 | | | | | | | Note: Operational sales growth, adjusted operational EPS growth, and free cash flow are non-GAAP measures. See page 46 for details. Our sales growth and EPS results do not include the impact of our Actelion Ltd. acquisition since it was not included in the goals. We summarize our performance against our financial and strategic goals and the performance of each of our businesses on pages 44 to 46.
| | | | | | | | | | Compensation Decisions for 2017 | | The Board believes the company largely met or exceeded its combined financial and strategic goals. It recognized Mr. Gorsky’s 2017 performance by awarding him an annual performance bonus at 110% of target and long-term incentives at 115% of target. After reviewing market data and other factors, the Board adjusted Mr. Gorsky’s salary rate by 3.1% to $1,650,000 (effective February 26, 2018).
| | | | 2017 Amount ($) | Percent of Target (%) | | | | Salary Earned | $1,600,000 | | | | | Annual Performance Bonus | 3,080,000 | 110% | | | | Long-Term Incentive Awards | 14,352,000 | 115% | | | | Total Direct Compensation | $19,032,000 | | | | | | | | We describe the performance and compensation of our Chairman/CEO on page 47 and our named executive officers on pages 48 to 51.
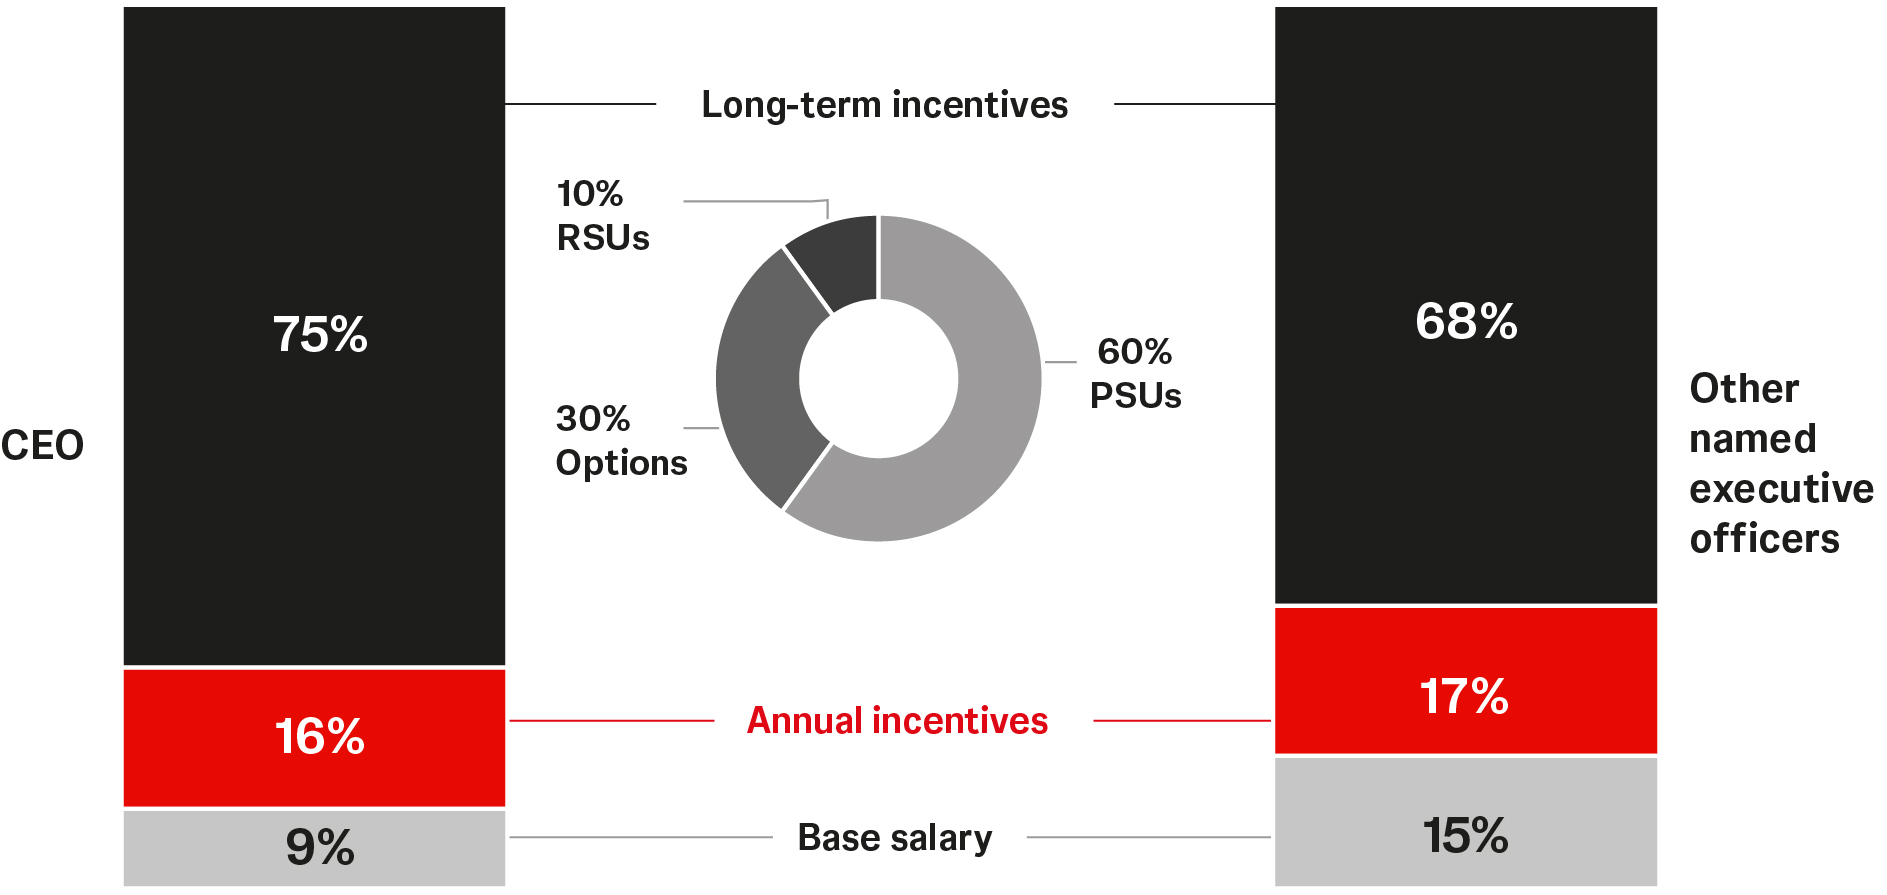
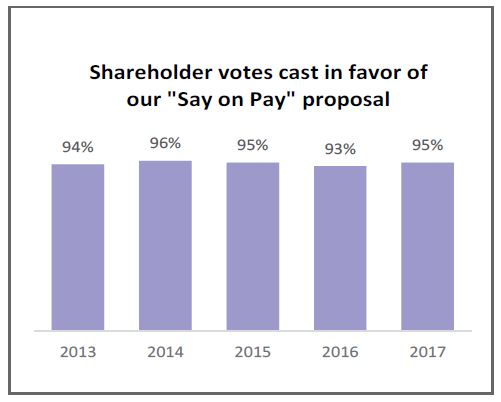
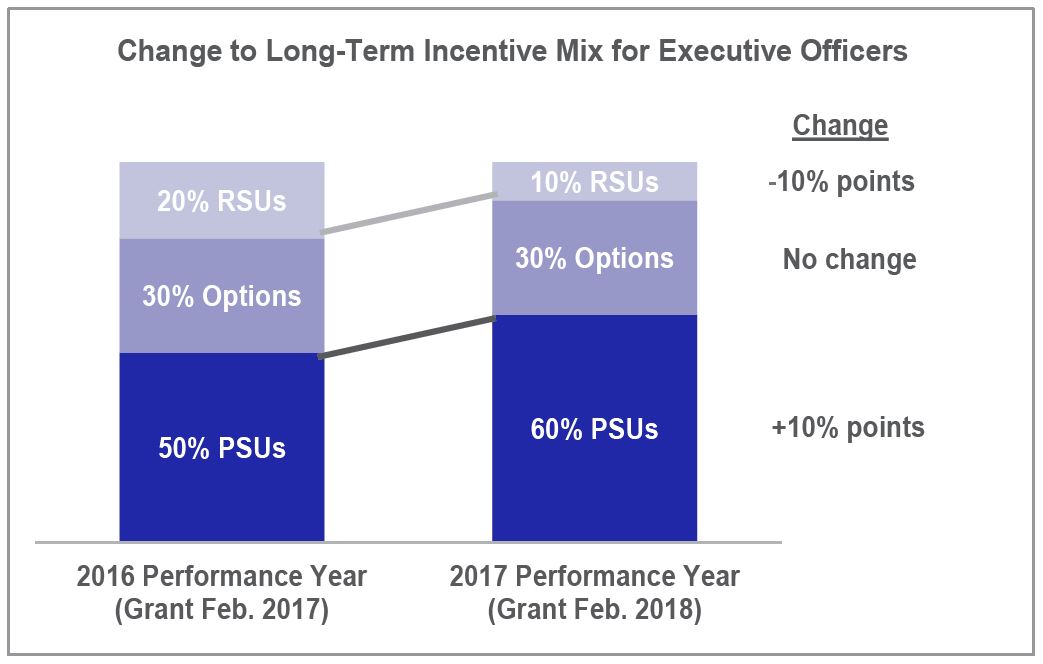
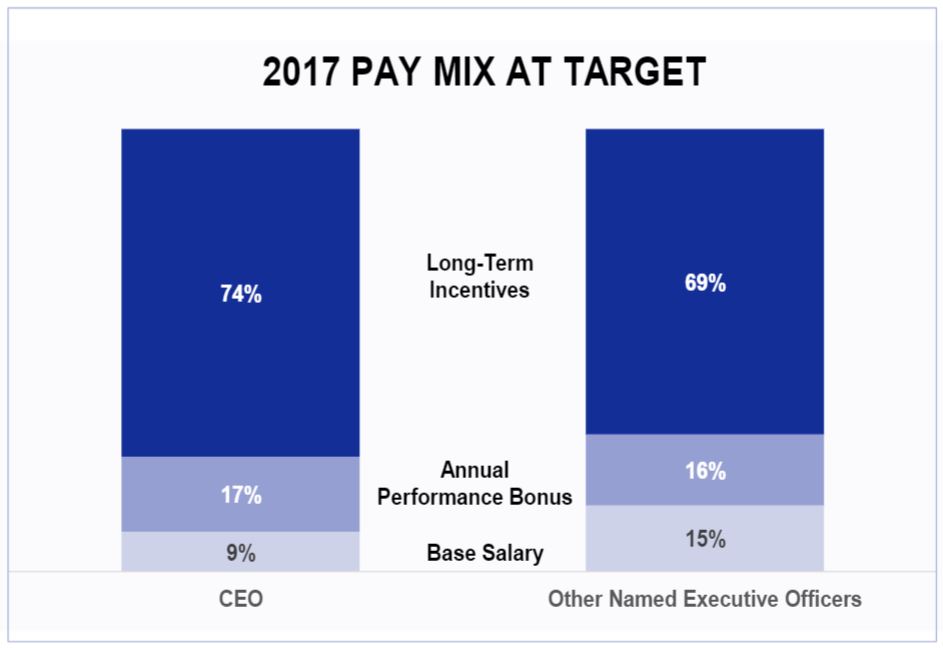
| | | | | | | | | | Update on Performance Share Unit Awards vs. Goals | | Our 2015-2017 Performance Share Units (PSU) paid out at 136.0% of target driven primarily by our 3-year Total Shareholder Return (TSR) exceeding our competitors and EPS performance exceeding our goals. We describe the PSUs earned under all three of our PSU grants that were active in 2017 on pages 52 to 54. | | | | | | | | | | Shareholder Outreach | | Our Lead Director and management discussed our executive compensation program with our shareholders. Our shareholders continued to strongly support our program. Our “Say on Pay” vote has been 93% or more in favor since 2013. See page 55 for more detail. | | | | | | | | | | Compensation Program Changes | | In 2017, we increased the weight of our PSUs to 60% for our 2018 long-term incentive grant based on: shareholder feedback, competitive data, and our objective of increasing the focus on long-term performance. The weighting is: 60% PSUs, 30% options, and 10% RSUs. See page 55 for more detail. |
| | | | | | 2018 Proxy Statement - 43
|
2017 COMPANY PERFORMANCE
We delivered solid performance in 2017. We largely met or exceeded our combined financial and strategic goals. This was driven by strong performance in our Pharmaceutical business. We made good progress on many important strategic initiatives that will benefit our company in future years.
We summarize the company's performance against financial and strategic goals below. We also summarize the performance of each of our businesses. We set our goals based on our long-term strategic objectives, our product portfolio and pipeline, and competitive benchmarking. | | | | | | | | | Performance against our 2017 Financial Goals | | We met or exceeded all our financial goals in 2017. We:
•
Met our operational sales growth goal.•
Met our adjusted operational earnings per share (EPS) growth goal.•
Exceeded our free cash flow goal.Our annual goals are set consistent with our long-term strategic objectives of growing sales faster than our competitors and earnings faster than sales. Our sales growth and EPS results do not include the impact of our Actelion Ltd. acquisition since it was not included in the goals.
| | | | Note: Operational sales growth, adjusted operational EPS growth, and free cash flow are non-GAAP measures. See page 46 for details. | | | | | | | Performance against our Long-Term Strategic Goals | | We made good progress on our strategic objectives. We exceeded on some, fell short on others, and made important strategic moves that will benefit our company in future years.
•
Creating Value through Innovation: We partially met our objectives that measure the health of our priority business platforms across all 3 businesses. We:•
Gained or held share in 12 of 15 key product platforms and exceeded sales growth targets in 6 of 15 of them.•
Achieved 100% of our priority innovation milestones.•
Advanced our robust pipeline by launching key new products and line extensions across our 3 businesses.•
Invested more than $10 billion in research & development in 2017. We believe that sustaining investments in innovation is the most important aspect of our strategy.•
Global Reach with Local Focus: We did not meet our objectives that measure the health of our business in regions offering significant growth opportunities. We:•
Fell short of our Medical Devices and Consumer sales goals and Pharmaceutical BRIC-market (Brazil, Russia, India, and China) sales goal.•
Exceeded our sales goals in our Pharmaceutical business in developed markets and non-BRIC emerging markets which drove the achievement of our company-wide growth goal.
|
| | | | 2018 Proxy Statement - 44
| | |
| | | | | | | | | Performance against our Long-Term Strategic Goals | | •
Excellence in Execution: We exceeded our objectives that track elements we need to execute to unleash additional growth opportunities. We:•
Made strategic acquisitions to enhance our future growth, including Actelion Ltd. and Abbott Medical Optics Inc.•
Achieved our Enterprise Standards and Productivity annual savings goal.•
Met or exceeded all our quality goals.•
Leading with Purpose: We met our objectives that measure our organizational health, diversity, and reputation. We:•
Strengthened our leadership talent pipeline, advanced diversity, and exceeded our employee engagement benchmarks.•
Maintained our high reputational standing, ranking #17 among Fortune’s Most Admired Companies and placing #1 in the pharmaceutical industry for the 5th consecutive year. | | | | | | | Performance by Business | | •
Pharmaceuticals exceeded its operational sales growth, operational income, and cash flow goals. In 2017, it:•
Advanced our innovation pipeline with the approval of TREMFYA® for treatment of moderate to severe plaque psoriasis, and completed the acquisition of Actelion Ltd.•
Maximized the value of our in-market brands through line extension approvals, including: SIMPONI®, STELARA®, XARELTO®, DARZALEX® and IMBRUVICA®.•
Consumer exceeded its cash flow goal, met its operational income goal, and did not meet its operational sales growth goal. In 2017, it:•
Maintained market share against our competitors in 4 of our 6 core platforms, despite category slowdowns.•
Advanced our eCommerce capabilities.•
Medical Devices met its cash flow goal and did not meet its operational sales and income goals. In 2017, it:•
Increased market share in 3 of our 6 key product platforms.•
Exceeded our operational sales growth goal and gained market share in our Vision Care business.•
Managed our product portfolio: acquiring Megadyne Medical Products, Inc. (energy) and Neuravi Limited (neurovascular); integrating Abbott Medical Optics Inc.; and divesting the Codman Neurosurgery business.
|
| | | | | | 2018 Proxy Statement - 45
|
| | | | | | | | | | | | | Details on Non-GAAP Performance Measures | | | | | | |
l | Operational Sales Growth: Operational Sales Growth is the sales increase due to volume and price, excluding the effect of currency translation. ◦ See page 16 of "Item 7. Management’s Discussion and Analysis of Results of Operations and Financial Conditions” of our Annual Report on Form 10-K for the fiscal year ended December 31, 2017 (2017 Form 10-K) for our operational sales growth.◦ We excluded the impact of our Actelion Ltd. acquisition since it was not included in the goals. | | | | | | 2017 Operational Sales Growth % | | | | | | | Sales Growth Currency Translation | 6.3% (0.3%) | | | | | | | Operational Sales Growth | 6.0% | | | | | | | Impact of Actelion Ltd. acquisition | 2.0% | | | | | | | | Operational Sales Growth (without Actelion Ltd.) | 4.0% | | | | | | | | | | l
| Free Cash Flow: Free cash flow is the net cash from operating activities less additions to property, plant and equipment. The figures are rounded for display purposes. Cash flow from operating activities $21.1 billion Additions to property, plant and equipment -$3.3 billion Free Cash Flow $17.8 billion | | | l
| Adjusted Operational EPS Growth: Adjusted EPS and adjusted operational EPS are non-GAAP financial measures. ◦ Adjusted EPS excludes special items and intangible amortization expense as disclosed in Exhibit 99.2O to the company’s Current Report on Form 8-K dated January 23, 2018 and in “Reconciliation of Non-GAAP Financial Measures” of our 2017 Annual Report included in our proxy materials.◦ Adjusted operational EPS growth also excludes the effect of currency translation.◦ Below is a reconciliation of diluted EPS (the most directly comparable U.S. GAAP measure) to adjusted EPS and adjusted operational EPS.◦ We excluded the impact of our Actelion Ltd. acquisition since it was not included in the goals. | | | | | | | | | | | | | | 2017 Actual $ per share | % Change vs. Prior Year* | | | | | | Diluted EPS Special Items and Intangible Amortization Expense | $0.47 6.83 |
| | |
| | | | | | | Adjusted EPS Currency Translation | 7.30 (0.06) |
| | 8.5 | % | | | | | | | Adjusted Operational EPS | 7.24 |
| | 7.6 | % | | | | | | | Impact of Actelion Ltd. acquisition | 0.07 |
| | | | | | | | | Adjusted operational EPS (without Actelion Ltd.) | 7.17 |
| | 6.5 | % | | | | | | | | | | | | | | | | * Prior year Adjusted EPS = $6.73 |
| | | | 2018 Proxy Statement - 46
| | |
CEO PERFORMANCE AND COMPENSATION DECISIONS
| | | | | | | |
Alex Gorsky | | Chairman, Board of Directors and Chief Executive Officer Performance: The Board based its assessment of Mr. Gorsky’s performance primarily upon its evaluation of the company’s performance. The Board believes the company largely met or exceeded its combined financial and strategic goals in 2017 under Mr. Gorsky’s leadership, as summarized under “2017 Company Performance” on pages 44 through 46. In addition to our company’s overall performance, the Board evaluated Mr. Gorsky’s performance against a set of strategic priorities. Mr. Gorsky:
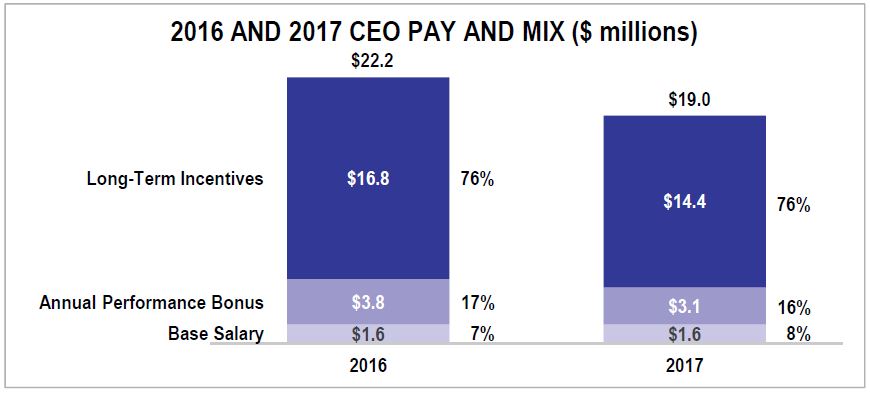
• Delivered on our financial and quality commitments.• Drove sales growth in the face of biosimilar competition and pricing pressure.• Managed our business portfolio with key acquisitions and divestitures.• Increased the value of our product pipeline.2018 CEO Compensation Decisions for 2017 Performance: The Board’s compensation decisions for Mr. Gorsky reflect the Board’s assessment of his 2017 performance. The Board recognized Mr. Gorsky’s 2017 performance by awarding him an annual performance bonus at 110% of target and long-term incentives at 115% of target. After reviewing market data and other factors, the Board adjusted Mr. Gorsky's salary rate by 3.1% to $1,650,000 (effective as of February 26, 2018). Mr. Gorsky’s total direct compensation for 2017 and, for comparison purposes, his total direct compensation for 2016 are displayed in the table below.
| | | | | 2016 | 2017 | | | | | Amount ($) | Percent of Target (%) | Amount ($) | Percent of Target (%) | | | | Salary Earned | $1,600,000 | | $1,600,000 | | | | | Annual Performance Bonus | 3,780,000 | 135% | 3,080,000 | 110% | | | | Long-Term Incentive Awards | 16,848,019 | 135% | 14,352,000 | 115% | | | | Total Direct Compensation | $22,228,019 | | $19,032,000 | | | | | | | | | Please see pages 49 to 51 for details on the awards and total direct compensation.
|
| | | | | | 2018 Proxy Statement - 47
|
OTHER NAMED EXECUTIVE OFFICER PERFORMANCE
| | The Compensation & Benefits Committee based its assessment of each of the other named executive officers upon its evaluation of the company’s performance and the individual performance of each named executive officer. Each of the named executive officers contributed to the company’s performance as a member of the Executive Committee and as a leader of a business or a function. See pages 44 through 46 for the Committee’s evaluation of the company’s performance for 2017. |
| | | | | |
Dominic J. Caruso
| | | Executive Vice President, Chief Financial Officer | | | In addition to his contribution to our company’s overall performance, Mr. Caruso: | | | • | Drove strong financial management throughout the year. | | | • | Played a significant role in the acquisition of Actelion Ltd. and Abbott Medical Optics Inc. | | | • | Worked closely with the investment community, having an excellent rapport, and being recognized as the #1 CFO in the Pharmaceutical sector by Institutional Investor. | | | • | Executed two significant debt offerings with favorable interest rates and actively engaged with legislators on U.S. tax reform.
| | | | | | | | | | | | | | |
Sandra E. Peterson
| | | Executive Vice President, Group Worldwide Chairman | | | In addition to her contribution to our company’s overall performance, Ms. Peterson: | | | • | Made progress in addressing quality, execution, and competitiveness for Medical Devices, strengthening its ability to compete in a changing healthcare environment.
| | | • | Led our Vision Care business to over-deliver its financial commitments (with eight consecutive quarters of above-market performance) and completed three acquisitions. | | | • | Led our Supply Chain group to deliver a strong year in which all quality and productivity metrics were met or exceeded. | | | • | Met our major Information Technology and Global Services objectives, and completed several strategic partnerships with technology companies. | | | | | | | | | | |
Joaquin Duato
| | | Executive Vice President, Worldwide Chairman, Pharmaceuticals | | | In addition to his contribution to our company’s overall performance, Mr. Duato: | | | • | Exceeded all our financial goals (sales, income, and cash flow) for Pharmaceuticals, delivering the 7th consecutive year of sales growth and exceeding our peers’ compound average sales growth rate for the 7-year period.
| | | • | Co-led the acquisition and successful integration of Actelion Ltd. | | | • | Led the Pharmaceutical Research and Manufacturers of America as Chairman. | | | • | Increased the value of our product pipeline. | | | | | | | | | | | | | | |
Paulus Stoffels, M.D.
| | | Executive Vice President, Chief Scientific Officer | | | In addition to his contribution to our company’s overall performance, Dr. Stoffels: | | | • | Delivered significant continued pharmaceutical pipeline growth. | | | • | Advanced our cross-sector R&D product portfolio and accelerated the sourcing of external innovation. | | | • | Co-led the acquisition and successful integration of Actelion Ltd. | | | • | Advanced significantly the innovation and impact of J&J Global Public Health (GPH) in Tuberculosis, HIV, Ebola and Zika. |
| | | | 2018 Proxy Statement - 48
| | |
2017 COMPENSATION DECISIONS FOR 2016 PERFORMANCE
How Compensation Decisions are Reported
In January and February of each year, we assess the performance of our named executive officers and our executive compensation philosophy, policies and procedures.
Following our Annual Meeting of Shareholders on April 25, 2024, the next advisory vote on executive compensation is expected to occur at the 2025 Annual Meeting of Shareholders, unless the Board modifies its policy on the frequency of holding such advisory votes. | | | | | | | | | | The Board of Directors recommends that shareholders vote, in an advisory manner, FOR approval of the compensation of our named executive officers and the executive compensation philosophy, policies and procedures described in the Compensation Discussion and Analysis (CD&A) section of this Proxy Statement. | | | | | | | | | | | | | | | Before you vote, we determine the:urge you to read the following for additional details on our executive compensation •Compensation Discussion and Analysis on pages 58 to 88 •Executive Compensation Tables on pages 89 to 121 | When casting your 2024 Say on Pay vote, we encourage you to consider: •Our named executive officers’ (NEOs) 2023 compensation is aligned with our performance. •Annual performance bonus earned for the prior year’s performance, incentive payouts are aligned to business performance.•Long-term incentive award granted in the first quarter of the yearperformance share unit payouts are based on our financial results and our relative total shareholder return. •We continue to engage with our shareholders on our executive compensation program and evaluate our programs to ensure alignment with our shareholders' interests. •Pay-for-performance is built into the prior year'sdesign of our incentive programs. •Despite continued macroeconomic uncertainty, our financial performance andwas strong. | | | | | | | |
A message from our Compensation & Benefits Committee Dear fellow shareholders: 2023 has been a pivotal year in Johnson & Johnson’s 137-year history. With the successful separation of Kenvue, the Company is now the clear global leader in healthcare innovation. Johnson & Johnson remains guided by Our Credo and its ambition to profoundly impact health for humanity through our lifesaving and life-enhancing products. The company's sharpened focus on Innovative Medicine and MedTech positions it to better address the complexity of the global healthcare environment and to navigate the rapidly evolving macroeconomic environment. We have seen this focus translate into robust performance across the Enterprise, with the Company exceeding its financial and strategic goals set at the start of the year. In addition, the Company continued to strengthen its innovation pipeline, with several catalysts which have the potential to enhance its future performance. Every year, we review the executive compensation structure to ensure that we are incentivizing strong results in a manner that is consistent with the values embodied in Our Credo. We also engage with our shareholders to gain feedback on the executive compensation program. The Company's 2023 Say on Pay vote won strong shareholder support at 93%. We believe that this level of shareholder support for the executive compensation program is a result of our continued engagement with our shareholders and the enhancements we have made to our executive compensation program and processes over the years. When evaluating 2023 performance, we conducted a comprehensive joint review with the Audit Committee of all items excluded from non-GAAP performance measures for the purpose of measuring results under the incentive compensation plans. The Committee believes that using certain non-GAAP metrics, which is common among our peers, helps avoid both unmerited windfalls and penalties that are beyond the control of executives, while promoting accountability and aligning compensation to performance objectives that accurately reflect company performance. For example, the 2023 annual incentive results and payout factors have excluded both the one-time, non-cash gain of $21 billion related to the Consumer Health separation in accordance with the Company’s adjusted non-GAAP results policies and past practices and the $7.1 billion settlement charge related to talc matters. We determined that the compensation program encompassed the effect of special items through their impact on our long-term equity compensation and that no adjustments to incentive payouts related to non-GAAP items were warranted. As a reflection of the strong financial outcomes achieved in 2023, the Enterprise annual incentives were achieved at 130.4% of target. The 2021-2023 PSUs paid out at 116.8% of target. We are confident that the future of the Company is strong and supported by a compensation program that rewards performance and aligns with shareholders' interests. We thank you for your continued feedback and respectfully request your support for our 2024 Say on Pay proposal. Sincerely, Salary rate for the upcoming year. | | | | | | | | | | | | | | | Marillyn A. Hewson Chair | | | Darius Adamczyk | | | | | | | D. Scott Davis | | | Hubert Joly | |
Compensation Committee report The Compensation & Benefits Committee of the Board of Directors (the Committee) has reviewed and discussed the section of this Proxy Statement entitled Compensation Discussion and Analysis with management. Based on this review and discussion, the Committee has recommended to the Board that the section entitled Compensation Discussion and Analysis, as it appears on pages 58 through 88, be included in this Proxy Statement and incorporated by reference into the Company’s Annual Report on Form 10-K for the fiscal year ended December 31, 2023. Marillyn A. Hewson, Chair
Darius Adamczyk
D. Scott Davis
Hubert Joly
Compensation discussion and analysis | | | | | | | | | | | | | | | 2023 NEOs Currently Serving | | | | | | | Joaquin Duato Chairman of the Board approveand Chief Executive Officer Joseph Wolk Executive Vice President, Chief Financial Officer John Reed, M.D., Ph.D. Executive Vice President, Innovative Medicine, R&D Jennifer Taubert Executive Vice President, Worldwide Chairman, Innovative Medicine Peter Fasolo, Ph.D. Executive Vice President, Chief Human Resources Officer The CD&A also describes the compensation of the Company’s former Executive Vice President, Worldwide Chairman, MedTech, Ashley McEvoy | | | | | | | | | | | | | | | | | | | | | | | | | | | | | | | | | | | | | | | | | | | | | | | | | | | | | | | | | | | | | | | | | | | | | | | | | | | | | | | | | | | | | | | | | | | | | | | | | | | | | | | | | | | | | | | | | | | | | | | | | | | |
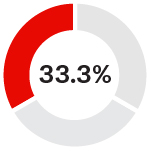
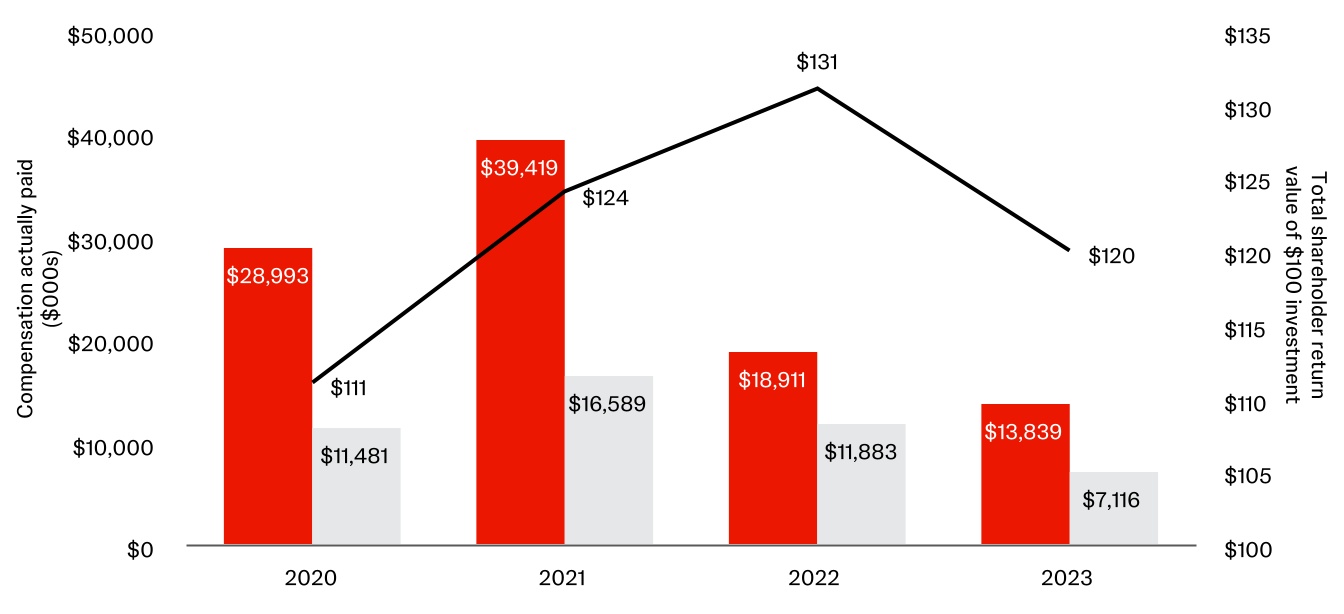
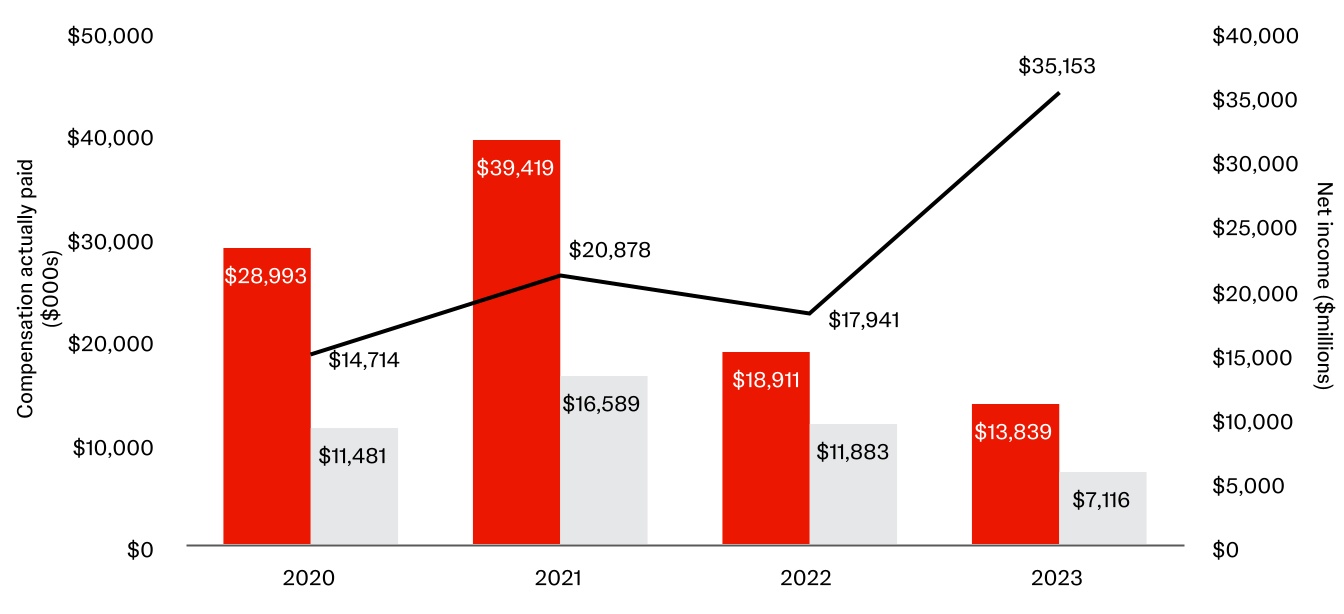
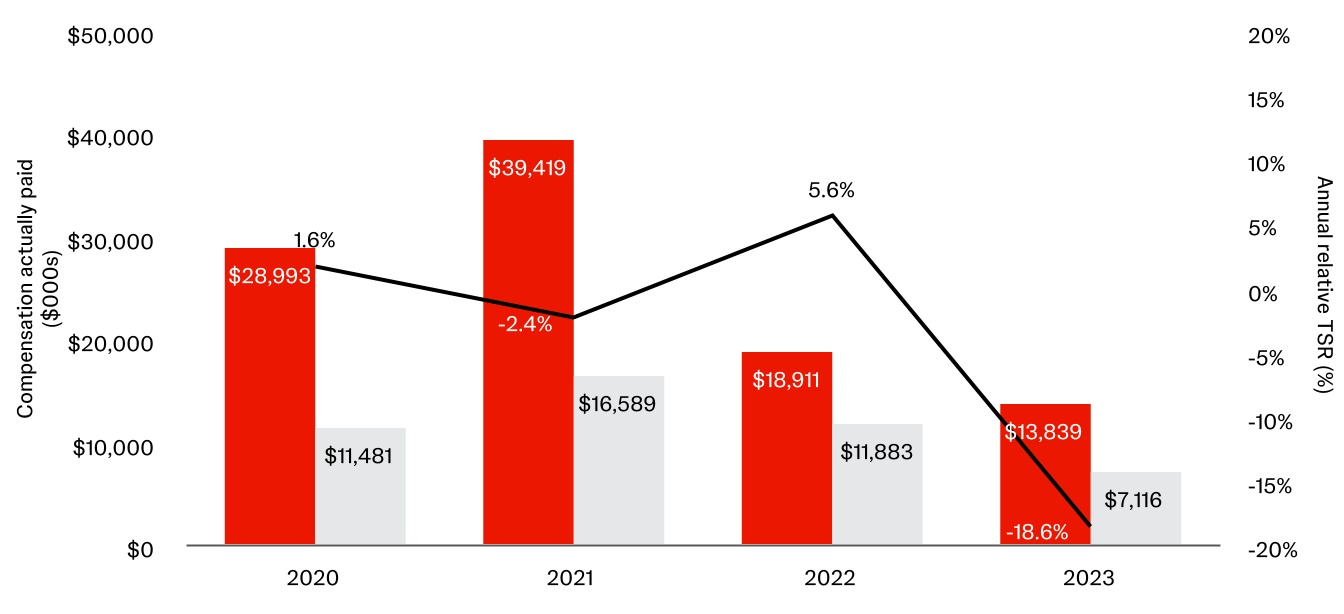
2023 Executive compensation summary Our Credo Since 1943, Our Credo has guided us in fulfilling our responsibilities to our customers, employees, communities and shareholders. In assessing our named executive officers’ contributions, we look to results-oriented measures of performance as well as how those results were achieved. We consider whether the decisions and actions leading to the results were consistent with the values embodied in Our Credo and the long-term impact of the decisions. 2023 Compensation highlights Pay mix Our pay mix at target for our named executive officers is a result of our compensation targets that emphasize long-term versus short-term compensation. 2023 Pay mix at target Company performance and incentive determinations We delivered strong performance in 2023. We exceeded our 2023 Enterprise financial goals, which were achieved at 130.5% of target. We also performed well against key Enterprise strategic objectives, which the Compensation & Benefits Committee assessed at 130.0% of target. On February 12, 2024, the Committee approved 2024 Enterprise annual incentive payouts at 130.4% of target based on the Company’s combined financial and strategic performance. We describe our 2023 annual incentive goals and performance under 2023 Annual incentive goals and performance on pages 67 to 69. Our 2021-2023 performance share units (PSUs) paid out at 116.8% of target. We describe the performance of our 2021-2023 PSUs in more detail on page 70.
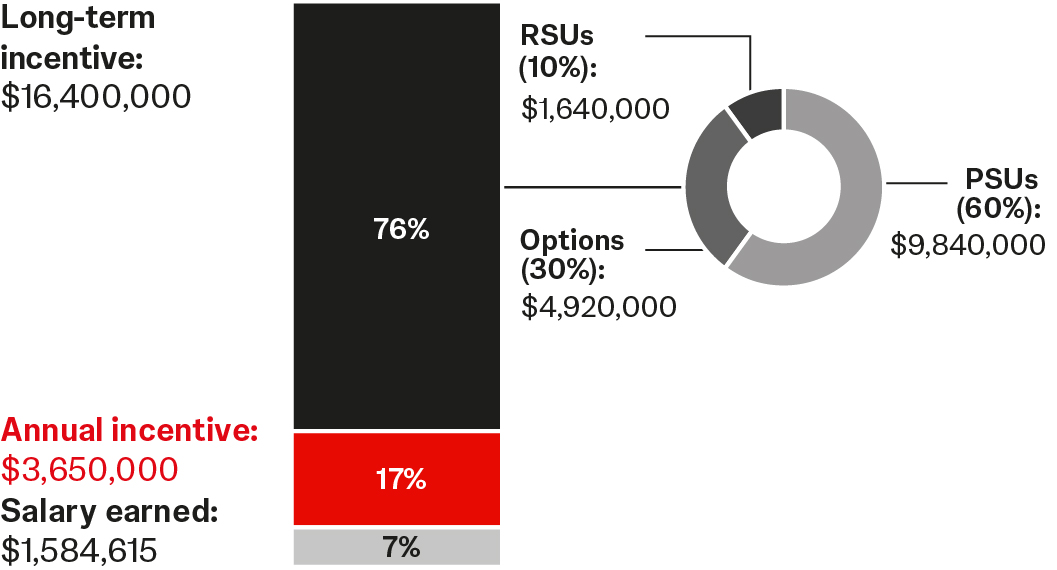
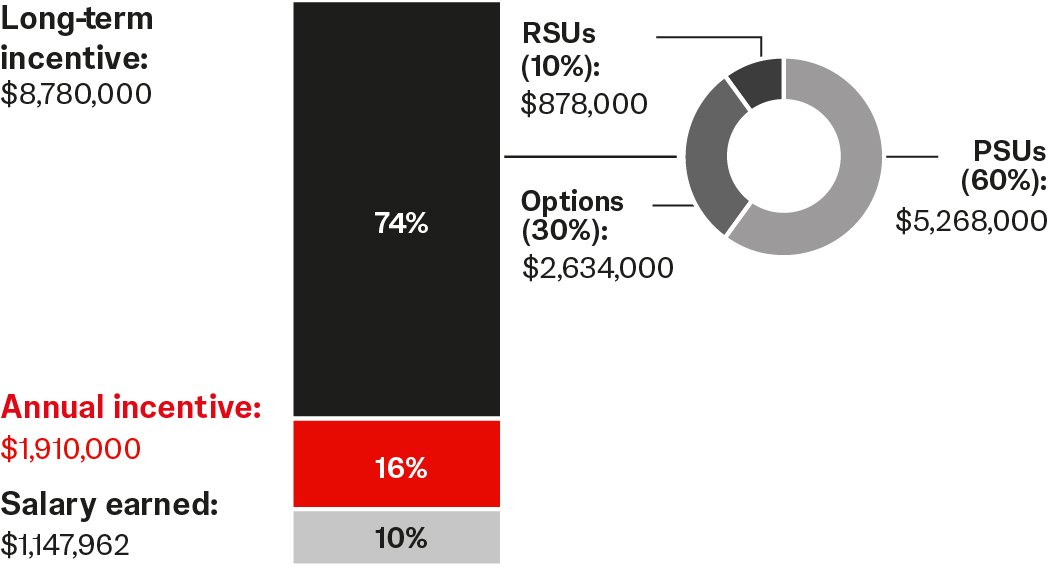
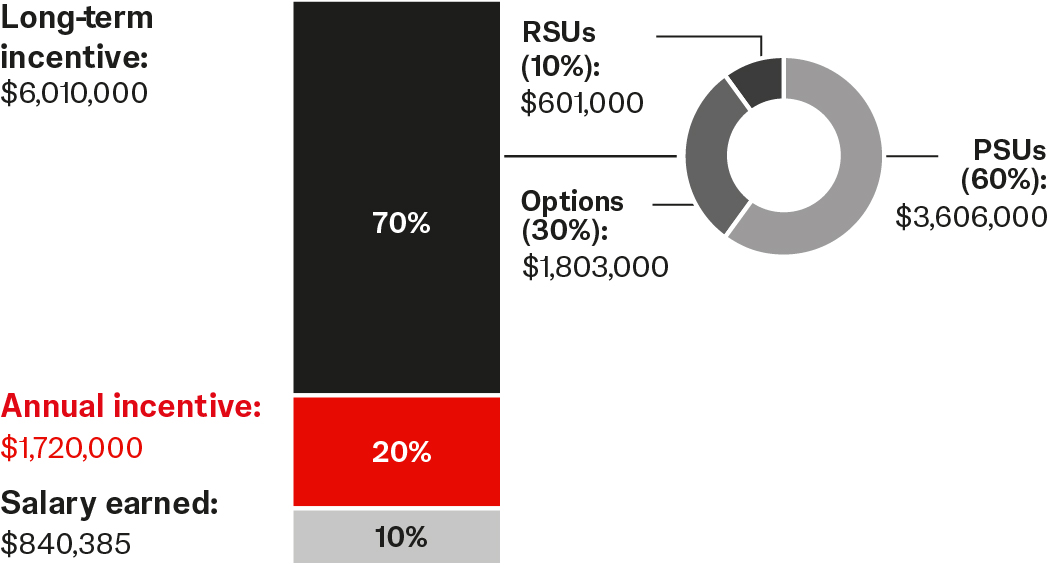
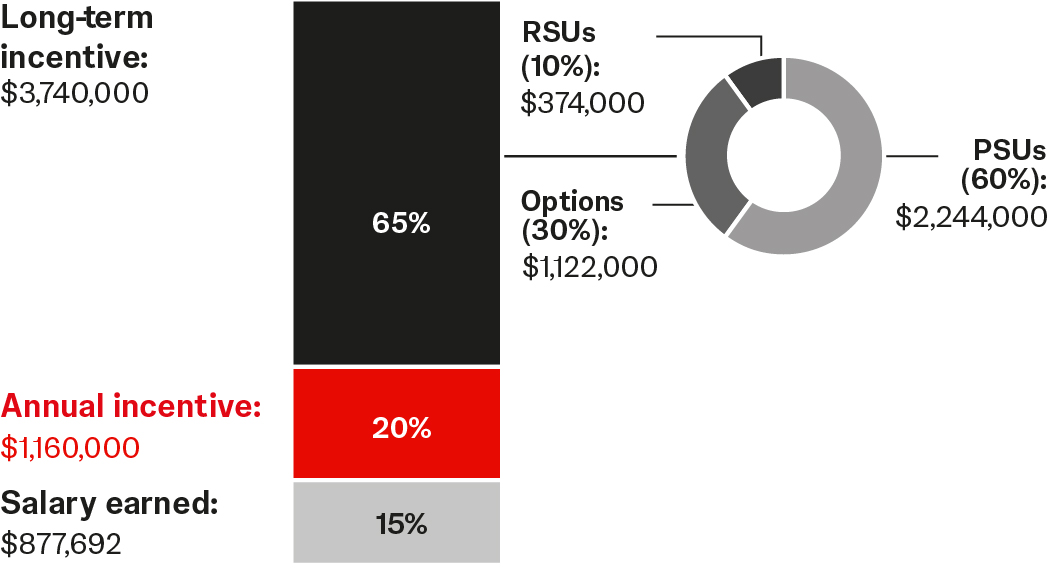
Total direct compensation In making annual pay decisions, the Committee focuses primarily on total direct compensation (TDC), which includes our three principal elements of executive compensation: base salary, annual incentives and long-term incentives. These elements are discussed in detail on pages 65 to 70. Total direct compensation reflects how an executive's pay relates to the Committee's assessment of Company, business unit and individual performance for the year. For this reason, 2023 TDC includes base salary earned in 2023, 2023 annual incentives and the planned long-term incentive (LTI) amounts approved by the Committee in February 2024, which were based on its assessment of 2023 performance. This differs from the February 2023 LTI award grant date fair values shown in the Summary Compensation Table on page 92, which were based on the Committee's assessment of 2022 performance. In addition, the compensation values reported in the Summary Compensation Table include certain elements (e.g., changes in pension values, which are impacted by assumptions like interest rates, and other compensation components) that we exclude from total direct compensation because they are not tied to performance and fall outside the scope of the Committee’s annual pay decisions. 2023 Total direct compensation | | | | | | | | | | | | | | | | Base salary | Annual incentives | Long-term incentives | Total direct compensation | | J. Duato | $1,584,615 | $3,650,000 | $16,400,000 | $21,634,615 | | J. Wolk | 1,147,962 | 1,910,000 | 8,780,000 | 11,837,962 | | J. Reed | 840,385 | 1,720,000 | 6,010,000 | 8,570,385 | | J. Taubert | 1,130,000 | 1,720,000 | 7,100,000 | 9,950,000 | | P. Fasolo | 877,692 | 1,160,000 | 3,740,000 | 5,777,692 | | A. McEvoy | 1,059,231 | 1,050,000 | 0 | 2,109,231 |
2023 Say on Pay results and shareholder engagement | | | | | | | | | | | | | | | | | | | | | | | | What we heard Approximately 93% of the tables below, we summarize the decisions regarding the annual performance bonuses, long-term incentive awards, and salary rates. We also show the 2017 total direct compensation.votes were cast in favor of our executive compensation program as disclosed in our 2023 Proxy Statement (the Say on Pay vote). We believe that these tables best summarize the actions taken on the named executive officers’ compensation for the performance year. By contrast, most of the amounts required by the U.S. Securities and Exchange Commission’s (SEC) rules to be reported in the “Summary Compensation Table” on page 68 are the result of compensation decisions from prior years, earnings from prior long-term incentive awards, or participation in long-standing pension programs as follows. The:
Stock Awards and Option Awards are grants made in 2017 based on performance in 2016. For PSUs, grants from 2016 and 2015 are also included for the portion of the awards based on 2017 sales (since they were considered granted in 2017 according to U.S. accounting rules).
Non-Equity Incentive Plan Compensation includes dividend equivalent payments on our legacy cash-based long-term incentive plans. We stopped granting cash-based long-term incentives in 2012.
Change in Pension Present Value is not paid currently and the amount is highly sensitive to changes in mortality and interest rate assumptions.
Non-Qualified Deferred Compensation Earnings is the growth in value of our legacy cash-based long-term incentive plans above a reference rate. We stopped granting these long-term incentives in 2012.
| | | In the table below, we show the 2017 total direct compensation for our Chairman/CEO (shown on page 50), the total from the “Summary Compensation Table” on page 68, and the differences between the two amounts as described above. | | | Reconciliation of Our CEO's 2017 Total Direct Compensation to Summary Compensation Table (SCT) Total | 2017 Total Direct Compensation | $19,032,000 | Long-Term Incentives granted in 2018 for 2017 Performance | (14,352,000) | Stock Awards and Option Awards granted in 2017 based on 2016 performance (SCT columns D and E) | 17,408,759 | Dividend Equivalents on legacy cash-based long-term incentives (included in SCT column F) | 518,382 | Change in Pension Present Value (included in SCT column G) | 6,807,000 | Non-Qualified Deferred Compensation Earnings (included in SCT column G) | 152,144 | All Other Compensation (SCT column H) | 236,279 | Total from Summary Compensation Table (SCT column I) | $29,802,564 |
| | | | | | 2018 Proxy Statement - 49
|
2017 Total Direct Compensation
In the table below, we show the salary paid during 2017 and the annual performance bonus and long-term incentive grants approved on February 12, 2018 for performance in 2017 for each named executive officer. | | | | | | | | | | | A | B | C | D | E | | | Cash | Equity | | | Name | Salary ($) | Annual Performance Bonus ($) | Long-Term Incentive ($) | Total Direct Compensation ($) | | A. Gorsky | $1,600,000 |
| $3,080,000 | $14,352,000 | $19,032,000 | | D. Caruso | 932,600 |
| 1,230,000 |
| 5,150,000 |
| 7,312,600 |
| | S. Peterson | 1,057,500 |
| 1,270,000 |
| 5,630,000 |
| 7,957,500 |
| | J. Duato | 897,254 |
| 1,350,000 |
| 6,310,000 |
| 8,557,254 |
| | P. Stoffels | 1,173,023 |
| 1,530,000 |
| 6,700,000 |
| 9,403,023 |
|
Salary (Column B)
Column B includes the base salaries paid during 2017.
Annual Performance Bonus (Column C)
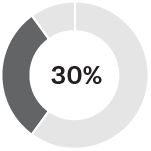
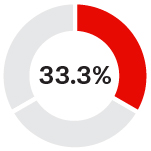
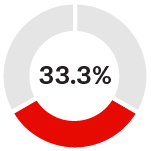
Based on 2017 company performance and individual performance as discussed on pages 44 to 48, the Board and the Committee awarded annual performance bonuses on February 12, 2018 ranging from 95% to 150% of targetthis strong support for the named executive officers. Seeofficer compensation benefited from our direct engagement with our shareholders and the “Grants of Plan-Based Awards” tablechanges we made to our executive compensation program and processes over the years. We describe our shareholder engagement in detail on page 7344. | | | | | | 93% Approve Say on Pay | | | | | | | | | What we did Shareholder engagement. Our shareholder outreach and engagement program occurs throughout the year beginning in the fall. In early summer, we review the voting results from the prior Annual Shareholders’ Meeting, our current performance, the external environment and market trends. We develop a shareholder outreach and engagement plan for the target bonus amounts.fall and review it with our advisors to ensure that our program is focused on topics of greatest interest to our shareholders. During the fall engagement season: | | | | | | | | | | | | 52% Long-Term Incentive Awards (for 2017 performance) (Column D)of our outstanding shares
| | 38% The Boardof our outstanding shares
| We met with proxy advisory firms and other interested parties. | | | | | Role of our Lead Director and Committee granted long-term incentive awards on February 12, 2018 (ranging from 105%Chair in our shareholder engagement Our Committee Chair and Lead Director participated in many of these meetings, including with seven of our top 25 shareholders. | | | | | We reached out to 160%shareholders representing approximately 52% of target) to the named executive officers based on their 2017 performance, impact on the company’s long-term results, competitive market data,our shares outstanding. | We engaged with approximately 48 U.S. and long-term potential within the organization.In the table below, we show: the total long-term incentive awards granted; the weightinginternational institutional shareholders representing approximately 38% of Performance Share Units (PSUs), Stock Options, and Restricted Share Units (RSUs); and the individual award values.
| | | | | | | Name | PSUs ($) | Options ($) | RSUs ($) | Total Long-Term Incentives ($) | | Award Weight | 60% | 30% | 10% | 100% | | A. Gorsky | $8,611,200 | $4,305,600 | $1,435,200 | $14,352,000 | | D. Caruso | 3,090,000 | 1,545,000 | 515,000 | 5,150,000 | | S. Peterson | 3,378,000 | 1,689,000 | 563,000 | 5,630,000 | | J. Duato | 3,786,000 | 1,893,000 | 631,000 | 6,310,000 | | P. Stoffels | 4,020,000 | 2,010,000 | 670,000 | 6,700,000 |
In the table below, we show the number ofour shares of PSUs, options, and RSUs granted. We determine the number of shares for each type of long-term incentive by dividing the dollar amount by the fair value per share and rounding to the nearest whole share.
| | | | | | Name | PSUs (#) | Options (#) | RSUs (#) | | Fair Value | $119.433 | $17.976 | $119.433 | | A. Gorsky | 72,101 | 289,519 | 12,017 | | D. Caruso | 25,872 | 85,948 | 4,312 | | S. Peterson | 28,284 | 93,959 | 4,714 | | J. Duato | 31,700 | 105,307 | 5,283 | | P. Stoffels | 33,659 | 111,816 | 5,610 |
outstanding.
| | | | | |
Shareholder engagement topics. Our shareholders have many different areas of interest. For each engagement, we endeavor to have the right personnel available to have an informed, meaningful discussion on the topics that are most important to them. Our 2023 engagement and other governance exchanges covered a wide range of important corporate governance, environmental and social stewardship, compensation and public policy issues. Treatment of special items including litigation charges in our compensation program. The Compensation & Benefits Committee understands that transparency concerning executive compensation, including the decision-making process itself, is important to many shareholders. The Committee believes the use of certain non-GAAP metrics is an appropriate and useful means of measuring company performance for purposes of incentive plans. This practice, which is common among our peers, helps avoid both unmerited windfalls and penalties that are beyond the control of executives, while promoting accountability and aligning compensation to performance objectives that accurately reflect company performance. For example, the 2023 annual incentive results and payout factors have excluded both the one-time, non-cash gain of $21 billion related to the Consumer Health separation in accordance with the Company’s adjusted non-GAAP results policies and past practices and the $7.1 billion settlement charge related to talc matters. Removing special items from GAAP results ultimately provides a more representative and comparable view of our operating performance and aligns with the performance metrics provided in our earnings guidance, financial reporting and other Company disclosures. | | | | 2018 Proxy Statement - 50
| | |
| | | | | | Details on Long-Term Incentive Fair Values | | • | The Committee takes a deliberate, thoughtful approach to each potential excluded item. As part of this process, the Committee reviews each item on an individual basis and considers whether excluding this item for purposes of executive compensation is appropriate in light of the totality of the facts and circumstances. The Compensation & Benefits Committee meets together with the Audit Committee to review all items excluded from GAAP performance measures for the purpose of measuring results under our annual and long-term incentive plans. The Compensation & Benefits Committee considers the appropriate treatment of non-GAAP items, including significant one-time litigation charges, in executive session before deciding whether to include or exclude each item. The table below lists factors the Compensation & Benefits Committee considers in its review: PSU Fair Value:
| | | • | $119.433 was the estimated grant date fair value used to determine the number of PSUs granted. | | | • | We assumed the estimated grant date fair value per PSU to be equal to the estimated grant date fair value per RSU to determine the number of PSUs, because: | | | | • | The RSU fair value equals the value of a PSU at 100% of target.
| | | | • | The fair values for the portions of the PSU award tied to the sales goals for the second and third years of the performance period are determined at the beginning of the second and third years when the sales goals for those years are set. | | • | Option Fair Value:
| | | • | $17.976 was the grant date fair value used to determine the number of options granted.
| | | • | $129.51 was the option exercise price based on the average of the high and low prices of our common stock on the NYSE on the grant date. | | | • | We used the Black-Scholes option valuation model to calculate the grant date fair value with the following assumptions: | | | | • | 15.77% volatility based on a blended rate of historical average volatility and implied volatility based on at-the-money traded Johnson & Johnson stock options with a life of two years.
| | | | • | 2.70% dividend yield.
| | | | • | 2.77% risk-free interest rate based on a U.S. Treasury rate of seven years.
| | | | • | 7-year option life. | | • | RSU Fair Value: | | | • | $119.433 was the grant date fair value used to determine the number of RSUs granted.
| | | • | We determined the grant date fair value for the RSU awards based on the average of the high and low prices of our common stock on the NYSE on the grant date ($129.51) discounted by an expected dividend yield of 2.70% since dividends are not paid on the RSUs prior to vesting. | | | | | | | Factor | Committee perspective |
2018 Salary Rates
We do not guarantee annual salary increasesAlignment of shareholder and they are not automatic. executive interests | The Board and Committee reviewed: performance, market data, responsibilities, and experience in determiningstrives to ensure that the base salary rates for our named executive officers. Based on these factors, the Board and Committee adjusted Mr. Gorsky’s salary rate for 2018 by 3.1%, adjusted Mr. Duato’s salary rate by 4.3%, and did not change the salary rates for the other named executive officers.The following table shows the annual base salary rate approved for each named executive officer. The annual base salary rates are all effective as of February 26, 2018.
| | | | | | | Name | 2017 Base Salary Rate ($) | 2018 Base Salary Rate ($) | | A. Gorsky | $1,600,000 | $1,650,000 | | D. Caruso | 936,800 |
| 936,800 |
| | S. Peterson | 1,072,050 |
| 1,072,050 |
| | J. Duato | 901,300 |
| 940,000 |
| | P. Stoffels | 1,178,300 |
| 1,178,300 |
|
| | | | | | 2018 Proxy Statement - 51
|
2017 UPDATE ON PERFORMANCE OF PERFORMANCE SHARE UNIT AWARDS VERSUS GOALS
In 2017, we completed the first year of the PSU performance period for our 2017-2019 awards, the second year of the PSU performance period for our 2016-2018 awards, and the third year of the PSU performance period for our 2015-2017 awards.
Performance Share Units Earned to Date
In the table below, we show the PSUs earned to date highlighting the contribution of the performance periods completed in 2017. We determine the number of PSUs earned based on our adjusted operational EPS and relative Total Shareholder Return (TSR) performance at the end of the 3-year performance period. We pay out earned PSUs at the end of the 3-year performance period. | | | | | | | | | | | | | PSUs Earned Based on Performance to Date | | Performance Period and Performance Measures | Weight | 2015 | 2016 | 2017 | 2018 | 2019 | | Total | | 2015 - 2017 Performance Share Units | | | | | | | | | | Operational Sales | 1/3rd | 106.3% | 118.2% | 95.0% | | | | 35.5% | | Cumulative Adjusted Operational EPS | 1/3rd | 141.5% | | | | 47.2% | | Relative TSR | 1/3rd | 160.0% | | | | 53.3% | | Total | | | | | | | | 136.0% | | 2016 - 2018 Performance Share Units | | | | | | | | | | Operational Sales | 1/3rd | | 118.2% | 95.0% | TBD 2018 | | | 23.7% | | Cumulative Adjusted Operational EPS | 1/3rd | | TBD 2016-2018 | | | 0.0% | | Relative TSR | 1/3rd | | TBD 2016-2018 | | | 0.0% | | Total | | | | | | | | 23.7% | | 2017 - 2019 Performance Share Units | | | | | | | | | | Operational Sales | 1/3rd | | | 95.0% | TBD 2018 | TBD 2019 | | 10.6% | | Cumulative Adjusted Operational EPS | 1/3rd | | | TBD 2017-2019 | | 0.0% | | Relative TSR | 1/3rd | | | TBD 2017-2019 | | 0.0% | | Total | | | | | | | | 10.6% | | Note: The percentages above are rounded to one decimal for display purposes. |
PSU Performance versus Goals for Performance Periods Completed in 2017 | | | | | | | | | | | | | 2017 Operational Sales Goals | 2015 - 2017 Cumulative Adjusted Operational EPS Goal | 2015 - 2017 Relative TSR Goal | | Level | Operational Sales ($ Millions) | PSUs Earned (% of target) | Cum. Adj. Op. EPS Goal | PSUs Earned (% of target) | Relative TSR Goal | PSUs Earned (% of target) | | Maximum | $78,910 | 200% |
| $22.72 | 200% |
| 10.0 % points | 200% |
| | Target | 75,150 | 100 |
| 20.65 | 100 |
| 0.0 % points | 100 |
| | Threshold | 71,390 | 50 |
| 18.58 | 50 |
| (10.0) % points | 50 |
| | <Threshold | < 71,390 | 0 |
| < 18.58 | 0 |
| < (10.0) % points | 0 |
| | Result | $74,771 | 95.0% |
| $21.51 | 141.5% |
| 6.0 % points | 160.0% |
| Note: Operational sales and cumulative adjusted operational EPS are non-GAAP measures. See page 54 for details.
|
If performance falls between threshold and target or between target and maximum, we determine the percentage of target earned using interpolation. If performance is below threshold for a goal, the percentage of target earned for that goal is 0%. If TSR is negative, the percentage of target earned based on TSR performance would be capped at 100%.
| | | | 2018 Proxy Statement - 52
| | |
Our PSU Goal Setting Process
Our PSU goals support our long-term objectives to grow sales faster than our competitors and grow earnings faster than sales. Sales growth drives quality EPS growth and quality EPS growth drives TSR growth, all of which drive shareholder value creation.
During the first quarter of the year, the Committee establishes the goals for the next PSU award 3-year cycle. It reviews the company’s performance against the PSU goals on a quarterly basis. Following year-end, the Committee certifies the result for the year’s operational sales performance and certifies the EPS and TSR results for the completed 3-year award cycle.
Our PSU goals are based on our long-term strategic plan and take into account our product portfolio and pipeline, anticipated healthcare market growth and other external factors, including the competitive landscape. The sales goals and first-year EPS goal are also set toCompany’s compensation programs closely align with the annual guidance providedexperience of our shareholders. We carefully consider feedback from our shareholders regarding compensation programs, policies and decisions.
| | Best interests of the Company and shareholders | The Committee considers the totality of the circumstances in deciding whether the exclusion is in the best interest of the Company or shareholders. For example, a significant acquisition- or divestiture-related item may not have been considered when incentive goals were originally set, and should therefore be excluded from the final results. Similarly, a legal settlement may be in the best interests of the Company and our shareholders even if the allegations lack merit. Executives should not be rewarded for windfalls or penalized for making difficult decisions. | | Impact on behavior | The Committee considers whether the exclusion of each special item will incentivize future executive decision-making in the best interest of the Company and shareholders. | | Role of current executives | The Committee considers the roles of the executives and whether these individuals had any responsibility or alleged misconduct related to the investment community. The 3-year TSR goal is set at meetingunderlying cause of the performanceexcluded item. | Legal determination of our Competitor Composite Peer Group. See page 62 for more information on our Competitor Composite Peer Group.Our annual operational sales goals are based on actual sales from the prior yearresponsibility
| Regarding legal settlements, a legal determination of fault or admission of wrongdoing related to litigation charges, though not dispositive, may inform an assessment of responsibility and then aligned to the company’s annual operational sales growth guidance. Currency had a negativetherefore impact of approximately $0.9 billion on the 2016 sales base used to set the 2017 operational sales growth goal. The following table shows the 2016 operational and reported sales, the 2016 impact of currency, and the 2017 operational sales goal. | |
| | | | | ($ Millions) | Base Year Sales | | 2016 Operational Sales | $72,833 | Currency Translation | (943) | 2016 Reported Sales | $71,890 | 2017 Operational Sales Goal | | 2017 Operational Sales Growth Goal | 4.5 | % | 2017 Operational Sales Goal | $75,150 |
Fiscal 2023 special items - litigation. Following engagement with shareholders in 2023, and in the interest of providing greater transparency for our investors, the Company committed to provide disclosure of the Committee’s treatment of any litigation special item excluded from executive incentive metrics and representing more than $1 billion or 0.2% of the Company’s market capitalization, subject to exception or modification when the Company’s management determines that disclosure would be competitively harmful or reasonably lead to exposure to further or ongoing litigation. The Committee will also consider providing such disclosure for other significant items not meeting the threshold as appropriate and will note whether any exceptions or modifications were made to our disclosure, in accordance with the exception noted above. | | | | | | 2018 Proxy Statement - 53
|
| | | | | | | | | | | Details on Non-GAAP PSU Performance Measures | | | l | 2017 Operational Sales Performance: Operational sales growth is the sales increase due to volume and price, excluding the effect of currency translation. The following is a reconciliation of operational sales to reported sales (the most directly comparable GAAP measure).
| | �� | | | | | | | | | | | | | ($ millions) | | | | | | | 2017 Reported Sales | $76,450 | | | | | | | Currency Translation | (268) | | | | | | | PSU Plan Adjustments | (1,411) | | | | | | | 2017 Operational Sales | $74,771 | | | | | | | | | l | PSU Plan adjustments: significant acquisitions, divestitures and changes in accounting rules that impact sales to customers by more than 0.5%. | | | l | 2015-2017 Cumulative Adjusted Operational EPS Performance: The following is a reconciliation of 2015-2017 cumulative reported EPS to cumulative adjusted operational EPS: | | | | | | | | | | | | | | | ($) | | | | | | | Reported EPS | $11.88 | | | | | | | Special Items and intangible amortization expense
| 8.35 | | | | | | | Non-GAAP EPS | 20.23 | | | | | | | Currency Translation
| 1.97 | | | | | | | PSU Plan Adjustments
| (0.69) | | | | | | | Cumulative Adjusted Operational EPS
| $21.51 | | | | | | | | | | | | | | | | | Special items and intangible amortization expense | ($) | | | | | | | 2015 | 0.72 | | | | | | | 2016 | 0.80 | | | | | | | 2017 | 6.83 | | | | | | | 2015 - 2017 Total | $8.35 | | | | | | | | | | | l | PSU plan adjustments: (1) significant acquisitions, divestitures, share repurchases, and changes in accounting rules or tax laws that impact adjusted operational EPS results by more than 1%; and (2) earnings from products that were not approved when the targets were set. | | | | | | l | 2015-2017 Relative TSR Performance: | | | | | | | | | | | | | | | TSR from January 1, 2015 to December 31, 2017
| (%) | | | | | | | Johnson & Johnson | 13.1% | | | | | | | Competitor Composite Peer Group
| 7.1% | | | | | | | Relative TSR Performance (J&J minus Competitor Composite Peer Group) | 6.0% points | | | | | | | | | | | | l | TSR performance is calculated using trailing 20-day average closing stock prices. |
In 2023, Johnson & Johnson agreed to contribute up to the present value of $8.9 billion, payable over 25 years, to resolve all current and future talc claims against the Company and its affiliates in North America. The Company disclosed an accounting charge of $6.9 billion in the first quarter of 2023 and accrued an additional $0.2 billion in the second quarter. This is in addition to the $2.0 billion previously accrued in 2021 for talc litigation. Consistent with the factors described above, the Committee considered this litigation-related charge to determine the appropriate treatment for purposes of the executive compensation program.
In determining whether to include or exclude the $7.1 billion settlement charge from executive incentive metrics, the Committee considered the following factors, among others: •Alignment of shareholder and executive interests. The Committee appreciates the feedback from investors concerning the impact of significant litigation charges on the shareholder experience. The executive compensation program is accordingly designed to align executive and shareholder interests. Specifically, more than two-thirds of Company NEOs’ pay is comprised of equity awards and Company executives have to meet published ownership requirements. To the extent significant litigation charges impact the Company’s stock price, positively or negatively, our executives’ pay is similarly impacted. | | | | 2018 Proxy Statement - 54
| | |
SHAREHOLDER OUTREACH AND OUR COMPENSATION PROGRAM
| | | | | | In 2017, we held an annual advisory vote to approve named executive officer compensation, commonly known as “Say on Pay”. Since 2013, 93% or more of the votes cast voted in favor of our executive compensation program as disclosed in our Proxy Statements. We believe that this continued strong support for the named executive officer compensation resulted from our direct engagement with our shareholders and the changes we made to our executive compensation program over the past several years.
We regularly consider the feedback from our shareholders and we continue to evaluate our executive compensation program. During 2017, we continued our shareholder outreach on our executive compensation program. Our Lead Director and members of senior management had discussions with a diverse mix of U.S. and international institutional shareholders on our executive compensation program. We describe our shareholder engagement, feedback, and our responses starting on page 23 (under “Shareholder Engagement”).
| | | | Change in 2017
We increased the weighting of performance share units for our executive officers based on our shareholders' feedback, our competitive benchmarking, and to increase the focus on our long-term performance. Our 2018 long-term incentive grant based on 2017 performance reflects the change in mix as follows:
| | | | |
•Best interests of the Company and shareholders and impact on behavior. The Committee considered the quantum of executive pay with the talc litigation charge included and excluded. The Committee believes that incentives are strong motivators of future behavior. Including this significant charge in the executives’ incentive metrics could create an incentive that is not in our shareholders' interests by motivating executives to postpone or forgo legal actions or settlements that are in shareholders' long-term interests. We will continue to engage regularly with our shareholders to understand their concerns on executive compensation matters, including significant one-time litigation charges. | | | | | | 2018 Proxy Statement - 55
|
Executive Compensation Philosophy
KEY FEATURES OF OUR EXECUTIVE COMPENSATION PROGRAM•Role of current executives.The underlying events and decisions that resulted in the talc-related litigation charges occurred before Company executives assumed their current roles. Company executives have taken steps to mitigate the impact of the litigation on behalf of the Company and shareholders. The executive team determined that it was in the best interest of the Company and shareholders to resolve this matter as efficiently as possible.
•Legal determination of responsibility.Johnson & Johnson has made no admission of wrongdoing, nor has the Company changed its longstanding position that its talcum powder products are safe. The Company has prevailed in the majority of cases tried and continues to stress that the talc claims are unfounded and lack scientific merit. Based on the totality of the circumstances, the Committee determined it to be in the best interest of the Company and shareholders to exclude the $7.1 billion talc settlement charge from 2023 incentive plan results. Compensation governance best practices We believe that our executive compensation program includes key features that align the interests of the named executive officers with our shareholders and does not include features that could misalign their interests. | | | | What we do | |  Align CEO and executive pay with Company performance. Align CEO and executive pay with Company performance. | | | | | | | | What We Do | | What We Don't Do | | | | | | | | ü | Align CEO pay with company performance | | û | No automatic or guaranteed annual salary | | | | | | increases | | ü | Align the majority of named executive officer pay | | | | | | with shareholders through long-term incentives | | û | No guaranteed bonuses or long-term incentive | | | | | | awards | | ü | Balance short-term and long-term incentives | | | | | | | | û | No above-median targeting of executive | | ü | Cap incentive awards | | | compensation | | | | | | | | ü | Require executives to own significant amounts of | | û | No change-in-control benefits | | | company stock | | | | | | | | û | No tax gross-ups (unless they are provided
| | ü | Have a compensation recoupment policy | | | pursuant to our standard relocation practices) | | | applicable to our named executive officers | | | | | | | | û | No option repricing without shareholder | | ü | Actively engage with our shareholders | | | approval | | | | | | | | ü | Use an independent compensation consultant | | û | No hedging of company stock | | | reporting directly to the Committee | | | | | | | | û | No long-term incentive backdating | | | | | | | | | | | û | No dividend equivalents on unvested long-term | | | | | | incentives | | | | | | |
Align the majority of named executive officer pay with shareholders through long-term incentives.GUIDING PRINCIPLES
We design our executive compensation programs to achieve our goals of attracting, developing, and retaining global business leaders who can drive financial and strategic growth objectives and build long-term shareholder value. We use the following guiding principles to design our compensation programs:
Competitiveness: We compare our practices against appropriate peer companies that are of similar size and complexity, so we can continue to attract, retain, and motivate high-performing executives.
Pay for Performance: We tie annual bonuses and grants of long-term incentives to performance, including the performance of: our company, the individual’s business unit or function, and the individual.
Accountability for Short-Term and Long-Term Performance: We structure performance-based compensation to reward an appropriate balance of Balance short-term and long-term financial and strategic business results, with an emphasis on managing the business for long-term results.Our Board is responsible for oversight Cap incentive awards. Require executives to own significant amounts of risk management (including product development, supply chain, and quality risks) as described under “Risk Oversight” on pages 25 and 26. OurCompany stock. Employ a compensation program’s emphasis on long-term value helpsrecoupment policy applicable to reduce the possibility that our executives make excessively risky business decisions that could maximize short-term results at the expense of long-term value. |
| | | | What we don't do | |  No automatic or guaranteed annual salary increases. No automatic or guaranteed annual salary increases. No guaranteed annual or long-term incentive awards. No above-median targeting of executive compensation. No automatic single-trigger equity acceleration. No tax gross-ups (unless they are provided pursuant to our standard relocation practices). No option repricing without shareholder approval. No hedging, pledging or short selling of Company stock. No long-term incentive backdating. No dividend equivalents on unvested long-term incentives. |
Johnson & Johnson does not have any change-in-control agreements in place for any of the named executive officers. Our 2022 Long-Term Incentive Plan only provides for a change-in-control benefit in the event that outstanding awards granted under the plan are not assumed or substituted by the acquirer in connection with a change-in-control, in which case, the awards will vest and any performance conditions will be deemed to be achieved at the greater of target or actual performance levels as of the date of the change-in-control. If outstanding awards are assumed or substituted, the awards will remain outstanding and will continue to vest following the change-in-control.
2023 Executive compensation Guiding principles We design our executive compensation programs to achieve our goals of attracting, developing and retaining global business leaders who can drive financial and strategic growth objectives and build long-term shareholder value. We use the following guiding principles to design our compensation programs: •Pay for performance. We tie annual incentive payouts and long-term incentive grants to the performance of the Company, the individual’s segment or function and the individual. •Accountability for short-term and long-term performance. We structure performance-based compensation to reward an appropriate balance of short-term and long-term financial and strategic business results, with an emphasis on managing the business for long-term results. The Board is responsible for oversight of risk management (including product development, supply chain and quality risks) as described under Oversight of our Company beginning on page 36. Our compensation program’s emphasis on long-term value helps to reduce the possibility that our executives make excessively risky business decisions that could maximize short-term results at the expense of long-term value. •Alignment to shareholders’ interests. We structure performance-based compensation to align the interests of our named executive officers with the long-term interests of our shareholders. •Competitiveness. We compare our practices against appropriate peer companies that are of similar size and complexity, so we can continue to attract, retain and motivate high-performing executives.
Components of executive compensation Base salary, annual incentive and long-term incentives Below we describe the components of our total direct compensation, how we determine each component's amount and why we pay them. | | | | | | | | | | | | | | | | Component | Form | Vesting / performance period | How amount is determined | Why we pay each component | | | | | | Base salary | Cash | Ongoing | •We base salary rates on: •Competitive data •Scope of responsibilities •Work experience •Time in position •Internal equity •Individual performance | •Recognizes job responsibilities. | | | | | | | | | | | | Annual incentive | Cash | 1 year | •We set target awards as a percent of salary based on competitive data. •We determine award payouts based on business and individual performance. | •Motivates attainment of our shareholders.near-term priorities, consistent with our long-term strategic plan. | | | | | | | | | | | | Long-term incentives | Equity | 3 years (options: 10-year term) | •We set target awards as a percent of salary based on competitive data.
•We grant long-term incentives based on business and individual performance, contribution and long-term potential.
•We determine payouts based on achievement of long-term operational goals, TSR and share price appreciation.
| •Motivates attainment of our long-term goals, TSR and share price growth. •Retains executives. | | |
| | | | 2018 Proxy Statement - 56
| | |
Components of Executive Compensation
BASE SALARY, ANNUAL PERFORMANCE BONUS, AND LONG-TERM INCENTIVES
In the table below, we describe the components of our total direct compensation, how we determine their size, and why we pay them. | | | | | | | | | | Component | Form | Vesting / Performance Period | How Size is Determined | Why We Pay Each Component | Base Salary | Cash | Ongoing | l | We base salary rates on:
| l | Recognize job responsibilities | | | l | Competitive data
| | | l | ScopeLong-term incentivesBelow we describe the forms of responsibilities | | | l | Work experience | | | l | Time in position | | | l | Internal equity | | | l | Individual performance | Annual Performance Bonus | Cash | 1 year | l | We set target awards as a percent of salary based on competitive data
| l | Motivate attainment of our near-term priorities, consistent with our long-term strategic plan | l | We determine award payouts based on business and individual performance
| Long-Term Incentives | Equity | 3 years
(options: 10-year term)
| l | We set target awards as a percent of salary based on competitive data
| l | Motivate attainment of our long-term goals, TSR, and share price growth | l | We grant long-term incentives based on business and individual performance, contribution, and long-term potential
| l | Retain executives | l | We determine payouts based on achievement of long-term operational goals, TSR, and share price appreciation |
| | | | | | 2018 Proxy Statement - 57
|
Long-Term Incentives
In the table below, we describe the forms of long-term incentive we use for our named executive officers, their weighting, performance periods, how the payouts are determined and why we use them.
| | | | | | | | | | | | | | | | Long-term incentive form | Mix | Vesting / performance period | How payouts are determined | Why we use them | | | | | | | | | | | | Performance share units (PSUs) | | •0% to 200% vested three years after grant | •1/2 Earnings per share: three-year cumulative adjusted operational EPS. •1/2 Relative total shareholder return (TSR): three-year compound annual growth rate versus the competitor composite peer group. •Share price | •Aligns with our long-term objective of growing quality earnings. •Reflects overall TSR outcomes relative to our competitors. •Ties PSU value directly to the share price. | | | | | | | | | | | | Options | | •1/3 of grant vests per year •10-year term | •Share price appreciation | •Motivates share price appreciation over the long-term. •Reinforces emphasis on long-term growth aligned with our objectives. | | | | | | | | | | | | Restricted share units (RSUs) | | •1/3 of grant vests per year | •Share price | •Ties RSU value directly to the share price. |
Notes: •Cumulative adjusted operational EPS is a non-GAAP measure. See page 88 for details. •No dividend equivalents are paid on our PSUs, options or RSUs. •Beginning with the February 13, 2023 grant, options and RSUs vest one-third per year on each of the first, second and third anniversaries of the grant date. Options and RSUs granted before February 13, 2023 are 100% vested on the third anniversary of the grant date.
2023 Annual incentive goals and performance Performance against our Enterprise 2023 financial goals (70% weight) 2023 Financial goals Our operational sales and adjusted operational EPS Enterprise financial targets align with the guidance we provided to the investment community. We believe this links our compensation to how effectively we deliver on our public commitments to our shareholders. We set our goals based on our objective of creating long-term sustainable value, our product portfolio and pipeline, and competitive benchmarking. See Our annual incentive goal-setting process on page 69 for details. We established maximum and threshold payout levels around the financial targets based on a review of historical performance for each metric. If performance falls between threshold and target or between target and maximum, we determine the payout factor using interpolation. If performance falls below threshold for a goal, the percentage earned for that goal is 0%. For the purposes of assessing performance under our annual incentive program, we make certain adjustments to our financial measures that have been prepared in accordance with accounting principles generally accepted in the U.S. (GAAP), as detailed on page 86 and 87. Following the separation of Kenvue in August 2023, the Committee determined that the 2023 annual incentive goals no longer reflected the Company’s continuing operations. As a result, following the separation, the Committee adjusted our operational sales, adjusted operational EPS and free cash flow goals to remove the financial contribution from Kenvue. 2023 Financial results The Company’s performance was strong compared to our internal goals, particularly given the backdrop of macroeconomic volatility. At the Enterprise level, we exceeded our operational sales and adjusted operational EPS goals and met our free cash flow goal. As shown below, our overall Enterprise financial performance resulted in a calculated financial payout factor of 130.5% under our annual incentive plan. | | | | | | | | | | | | | | | | | | | | | | | | | 2023 Financial measures | Weight | Threshold
(50% payout) | Target
(100% payout) | Maximum (200% payout) | Results | Calculated payout | Weighted payout | Operational sales ($ millions) | | $77,758 | $81,850 | $85,943 | $84,812 | 172.4 | % | 57.5 | % | | Adjusted operational EPS | | $8.96 | $9.43 | $9.90 | $9.52 | 119.1 | % | 39.7 | % | Free cash flow ($ millions) | | $12,780 | $14,200 | $15,620 | $14,197 | 99.9 | % | 33.3 | % | | Financial payout factor | | | | | | | 130.5 | % |
Note: Operational sales, adjusted operational EPS and free cash flow are non-GAAP measures. See pages 86 and 87 for reconciliations to GAAP measures of performance. | | | | | | | 2024 Proxy Statement | 67 | | | | | | | | | | Long-Term Incentive Form | 2017 Mix | Vesting / Performance Period | How Payouts are Determined | Why We Use Them | Performance | 60% | l | 0% to 200% | l | Measures and Weight: | l | Aligns with our long-term objectives | Share Units | | | vested 3 years | | l | 1/3 Sales: 1-year Operational Sales for each year of the 3-year performance period
| | of growing sales faster than our | | | | after grant
|
Performance against our Enterprise long-term strategic goals (30% weight) 2023 Strategic goals The strategic payout factor is determined by the Committee within a range of 0% to 200% based on its evaluation of performance versus our strategic objectives. Our strategic objectives cover a range of items critical to both our short- and long-term success. We prioritize excellence in our operational execution, product development and pipeline growth, our employees, key strategic initiatives that enable our continued growth and performance against our purpose-driven objectives. Not all strategic goals are measured against quantitative performance criteria because some goals are qualitative. The Committee considers both quantitative and qualitative results and applies discretion when evaluating performance and determining the payout factor. 2023 Strategic performance In February 2023, the Committee approved strategic goals aligned with long-term, sustainable value creation. Based on its evaluation of our performance against our strategic goals, the Committee determined a payout factor of 130.0% of target appropriately recognized both the successes and disappointments we experienced during 2023. The Committee’s assessment of our strategic goals and results is shown in the following table. | | | | | | | | | | 2023 Strategic goals | 2023 Assessment highlights | | | | | Critical business objectives | •We continued to grow market share in our key platforms and met or exceeded our supply chain goals. •We continued to grow our product pipeline, achieving all of our priority R&D milestones and innovation platform goals. •We greatly accelerated progress as a digital organization, exceeding our target in employee upskilling. We also performed strongly on our technology ecosystem and cybersecurity goals. •We exceeded our milestones in finalizing the separation of our Consumer Health business, and have distributed over 90% of Kenvue shares. | | | | | | | | Enabling our purpose | •We met our quality and compliance objectives, closing audit remediation gaps and reducing the number of health authority actions. •We achieved all our key safety goals. •We exceeded our human capital management goals, enhancing our talent pipeline and succession planning as well as the retention of Executive Committee and segment leaders. •We exceeded our global sustainability goals and continued to advance our efforts to fight global public health challenges and champion diversity in clinical trials. | | | | | | | | Enterprise strategic payout factor | 130.0% | | | |
| | | Sales for each year of the 3-year | | competitors and earnings faster | | | | | | | performance period | | than sales | | | | | | l | 1/3 Earnings per Share: 3-year Cumulative Adjusted Operational EPS
| l | Ensures quality earnings growth by motivating top line and bottom line growth | | | | | | l | 1/3 Relative Total Shareholder
| l | Reflects overall TSR outcomes | | | | | | | Return: 3-year Compound Annual
| | relative to our competitors
| | | | | | | 68 | | | | | | | | Growth Rate versus the | l | Ties PSU unit value directly |
2023 Annual incentives The 2023 annual incentive payouts for our CEO and other named executive officers were based 70% on financial goals and 30% on strategic goals. Messrs. Duato and Wolk and Dr. Fasolo were measured at the Enterprise level. Financial goals for Ms.Taubert and Dr. Reed were weighted 75% for Innovative Medicine and 25% on Enterprise performance. Financial goals for Ms. McEvoy were weighted 75% for MedTech and 25% on Enterprise performance. Furthermore, their strategic goals were aligned with the performance of their respective segments. Our financial goals are evaluated against identified threshold, target and maximum levels of performance. Our strategic payout factors are determined by the Committee, in its sole discretion, based on its evaluation of performance versus our strategic goals. In addition, the Committee may adjust individual awards on an exception basis within a range of 0x to 1.2x (subject to the 200% of target maximum). The Committee did not adjust any individual 2023 annual incentive payouts on an exception basis. The payouts can range from 0% to 200% of the target award as illustrated below. | | | | | | | | | | | | | | | | | | | | | Target Award | | Payout Factor
(70% Financial / 30% Strategic) | | Payout Range
(0% to 200% of Target) | | | | | |
Summary of named executive officer annual incentive payouts This table shows the final payout factor for Messrs. Duato and Wolk and Ms. Taubert and Drs. Fasolo and Reed. | | | | | | | | | | | | | Weight | 2023 Payout factors | Weighted payout | | Enterprise financial | 70.0 | % | 130.5 | % | 91.4 | % | | Enterprise strategic | 30.0 | % | 130.0 | % | 39.0 | % | | Enterprise payout factor | | | 130.4 | % |
The Committee used its discretion to reduce the Innovative Medicine segment annual incentive payouts by 3.8 percentage points, to 130.4% to align with the Enterprise score. The MedTech segment’s annual incentive payout factor was 85.0%. Our annual incentive goal-setting process Each fall, we undertake a rigorous planning process to develop our goals for the coming year. Our financial goals are used to develop the estimates that we provide to the investment community, are aligned with our long-term strategic plan and promote long-term, sustainable value creation. We use the following approach in setting our financial targets: •Operational sales. Align with our strategic objective to exceed market growth using the breadth of our portfolio. •Adjusted operational EPS. Consider our strategic plan, financial principles, competitive position and investment strategies. •Free cash flow. Target specific levels of productivity and budget for significant events as needed. We set our 2023 operational sales growth goal considering: •Continuing to drive innovation and market-leading sales growth in Innovative Medicine and MedTech, continued medical devices market recovery and improved market performance enabled by maximizing the value of recently launched products. We set our 2023 adjusted operational EPS growth goal considering: •The planned 2023 operational sales items noted above and our financial principles, while investing for the future. We set our 2023 free cash flow goal considering: •Our productivity in generating free cash flow from net income. •Budgeted amounts for anticipated significant events. | | | | | | | 2024 Proxy Statement | 69 | | | | | | | Competitor Composite Peer Group
|
2021-2023 Performance share unit payout Impact of significant one-time events on the open PSU performance periods In connection with the separation of Kenvue in August 2023, the Committee determined that the targets for the 2021-2023, 2022-2024 and 2023-2025 PSU awards no longer reflected the Company’s continuing operations. In September 2023, the Committee approved an adjustment to the outstanding PSU program targets to incorporate the impact of the 2023 separation of Kenvue, including: •The net financing impact related to the separation for the 2023-2025 PSU award. •The removal of the Consumer Health net income contribution to EPS for all outstanding PSU awards. •The modification of the TSR competitor composite peer group to remove the Consumer Health peers beginning in August 2023 for all outstanding PSU awards. Because the Consumer Health peer companies were removed from the TSR competitor composite peer group beginning in August 2023, the 2021-2023, 2022-2024 and 2023-2025 PSU awards were considered modified for accounting purposes. As a result of the modification, the accounting expense related to the 2021-2023, 2022-2024 and 2023-2025 PSU awards increased by less than 3% for each award. No additional PSUs were granted as a result of the modification. 2021-2023 PSU performance versus goals and payout as a percent of target Our 2021-2023 adjusted operational EPS performance was above target. However, our 2021-2023 TSR compound annual growth rate fell below target. Our 2021-2023 PSUs paid out at 116.8% of target as shown in the table below. If performance falls between threshold and target or between target and maximum, we determine the percentage of target earned using interpolation. If performance is below threshold for a goal, the percentage of target earned for that goal is 0%. If TSR is negative, the percentage of target earned based on TSR performance would be capped at 100%. | | | | | | | | | | | | | | | | | | | | | | | | | PSU Measure | Weight | Threshold
(50% payout) | Target
(100% payout) | Maximum
(200% payout) | Actual | Calculated
payout | Weighted
payout | | 2021-2023 Cumulative adjusted operational EPS | 1/2 | $26.06 | $28.96 | $31.86 | $30.62 | 157.3 | % | 78.7 | % | | 2021-2023 Relative TSR (CAGR) | 1/2 | 10% below composite | Equal to composite | 10% above composite | (4.7) points | 76.3 | % | 38.2 | % | | PSU payout factor | | | | | | | 116.8 | % |
Note: Cumulative adjusted operational EPS is a non-GAAP measure. See page 88 for details. The sum of the individual components may not reflect the total payout factor due to rounding. Our PSU goal setting process Our PSU goals are based on our long-term strategic plan, promote long-term sustainable value creation, and take into account our product portfolio and pipeline, anticipated healthcare market growth and other external factors, including the competitive landscape. Cumulative adjusted operational EPS. The EPS goal is set based on: •The operational EPS guidance for the first year, which is provided to the investment community. •Sales and EPS targets included in our strategic plan for the second and third years of the performance period. •Analysts’ expectations for the Company and the competitor composite peer group. •An EPS growth to sales-growth multiple aligned with a long-term goal of growing net income faster than sales. Relative total shareholder return. The three-year relative TSR goal is set to meet the performance of our competitor composite peer group, which undergoes annual review. See page 81 for more information on our competitor composite peer group.
| share price | | | | | l | Share Price | | | | | | | l | No dividend equivalents paid
| | | | | | | 70 | | Stock Options | 30% | l | 100% vested | l | Share price appreciation | l | Motivates share price appreciation |
Executive perquisites and other benefits Our named executive officers participate in the same employee benefits provided to all other non-union U.S. employees. In addition, they participate in the following benefits and perquisites: •Executive life insurance. Effective January 2015, we closed this program to new participants. We grandfathered prior participants. Mr. Wolk, Dr. Fasolo and Ms. Taubert participated in the program in 2023. •Personal use of Company aircraft and cars. Our named executive officers may use Company aircraft for limited personal travel and Company cars and drivers for commuting and other personal transportation. These perquisites are intended to enhance productivity, minimize distractions and ensure the safety of our executives. The incremental cost to the Company to provide these perquisites is included in the perquisites and other personal benefits detail on page 96. These values are not paid to our named executive officers. Beginning in 2020, we capped the value of the car and driver perquisite for our Executive Committee members at $24,999 annually. Amounts in excess of $24,999 must be reimbursed by the executive. •Home security. We reimburse limited home security system-related fees. We detail the executive life insurance premiums paid, values of personal use of Company aircraft and cars, and home security related costs in the All other compensation detail on pages 96 through 97. Our named executive officers pay the income taxes due on the value of these benefits and perquisites. Compensation decisions for 2023 performance Total direct compensation decisions In January and February of each year, we assess the performance of our named executive officers and we determine the: •Annual incentive payout for the prior year’s performance. •Long-term incentives granted in the first quarter of the year based on the prior-year's performance. •Salary rate for the upcoming year. The independent Directors approve the compensation decisions for the Chief Executive Officer. The Committee approves the compensation decisions for all other named executive officers. | | | | | | | 2024 Proxy Statement | 71 | | 3 years after | l | No dividend equivalents paid | | over the long-term
|
Reconciliation of total direct compensation | | | | | | | | | | | | | | | | | | | | | | | | | | | | | | | | | | | What is “total direct compensation"? In contrast to the summary compensation table (on page 92), our discussion of CEO and NEO pay decisions in this proxy (pages 73 to 76) uses a measure called “total direct compensation,” which the Committee believes provides a more accurate picture of its annual pay decisions and reflects its most recent assessment of Company, business unit and individual performance. Total direct compensation includes 2023 salary, 2023 annual incentive for the completed performance year and long-term incentives as described below. | | | | | | | | | | How the Committee views LTI award values | | | | | | | | | | | | | | | | | Total direct compensation | Includes the planned value of LTI awards approved by the Committee and granted in February 2024. | Award value relates to the Committee’s assessment of 2023 performance. | | | | | | | | | | | | | | | | | Summary compensation table | Includes the grant date fair value of LTI awards granted in February 2023. | Award values relate back to the Committee’s assessment of 2022 performance. | | | | | | | | | | | | | | | | | The SEC rules require the LTI awards granted in February 2023 to be reported in the summary compensation table in this Proxy Statement with a different valuation methodology than we use for total direct compensation. In addition, the compensation values reported in the summary compensation table include certain elements (e.g., changes in pension values, which are impacted by assumptions like interest rates and other compensation components) that we exclude from total direct compensation because they are not tied to performance and fall outside the scope of the Committee’s annual pay decisions. | | | | | | | | |
NEO performance and compensation summaries CEO performance | | | | | | | | | | | | | | | | Joaquin
Duato Chairman of the Board and Chief Executive Officer | Performance The Board based its assessment of Mr. Duato’s 2023 performance primarily upon its evaluation of the Company’s performance. The Company’s 2023 performance is summarized under 2023 Annual incentive goals and performance on pages 67 through 69. The Board believes the Company largely met or exceeded its combined financial and strategic goals in 2023 under Mr. Duato's leadership. The Board recognized Mr. Duato's performance by awarding him an annual performance bonus at 130.4% of target and long-term incentives at 125.0% of target. After reviewing market data and other factors, the Board did not change Mr. Duato's salary rate for 2024. At the Enterprise level, we exceeded our operational sales and adjusted operational EPS goals and met our free cash flow goal. Enterprise results were driven by overall performance in our segments. In addition to our Company’s overall performance, the Board evaluated Mr. Duato’s performance against a set of strategic priorities. Mr. Duato: •Delivered on our financial goals and our long-term financial outlook with record-level operational investments in R&D and product innovation to expand our product pipeline. •Performed strongly on our quality and compliance objectives, closing audit remediation gaps and reducing the number of health authority actions. •Advanced year-over-year capital allocation across R&D, acquisitions and dividends to shareholders. •Led our focus on data science, intelligent automation and cybersecurity. •Exceeded our milestones in finalizing the separation of our Consumer Health business. | | | | 2023 Total direct compensation Total direct compensation: $21,634,615 | 2024 Base salary rate Mr. Duato’s base salary rate did not change in 2024. | | | | l | Reinforces emphasis on long-term growth aligned with our objectives | l | 10-year term | | | |
| | | | | | | 2024 Proxy Statement | 73 | Restricted Share Units
|
Compensation decisions for 2023 CEO performance •In determining Mr. Duato’s 2023 annual incentive payout, the Board used the 2023 Enterprise annual incentive payout factor of 130.4% as summarized under 2023 Annual incentive goals and performance beginning on page 67. •The Board approved Mr. Duato’s long-term incentives for performance in 2023 at 125.0% of target in February 2024 to recognize his contributions during 2023 in fulfilling Our Credo responsibilities, improving our long-term financial outlook and executing the separation of our Consumer Health business. The Board believes the long-term incentives will further align Mr. Duato’s and shareholder interests. •Mr. Duato’s total direct compensation for 2021-2023 is displayed in the table below. | | | | | | | | | | | | | | | | | | | | | | | | | | | | Vice Chairman of the
Executive Committee | | CEO | | 2021 | | 2022 | | 2023 | | Amount
($) | Percent
of target
(%) | | Amount
($) | Percent
of target
(%) | | Amount
($) | Percent
of target
(%) | | Salary earned | $1,030,000 | | | $1,490,962 | | | $1,584,615 | | | Annual incentive payout | 1,670,000 | 130.0 | % | | 2,390,000 | 91.0 | % | | 3,650,000 | 130.4 | % | | Long-term incentive awards | 7,730,000 | 150.0 | % | | 15,990,000 | 130.0 | % | | 16,400,000 | 125.0 | % | | Total direct compensation | $10,430,000 | | | $19,870,962 | | | $21,634,615 | |
Other named executive officer performance The Committee based its assessment of each of the other named executive officers on its evaluation of the Company’s performance and the individual performance of each named executive officer. Each of the named executive officers contributed to the Company’s performance as a member of the Executive Committee and as a leader of a business or a function. See pages 67 through 69 for the Committee’s evaluation of the Company’s performance for 2023. | | | | | | | | | | | | | | | | | | | | Joseph
Wolk Executive Vice President, Chief Financial Officer | Performance In addition to his contribution to our Company’s overall performance, Mr. Wolk: •Drove our financial management processes that delivered results that met or exceeded financial expectations, proactively planning and managing our corporate functions and Enterprise budgets to contribute to our performance. •Successfully led our strategic efforts to separate our Consumer Health business, exceeding our internal milestones and reducing infrastructure costs. •Accelerated the digital transformation of the finance function by implementing best-practice financial processes and technology platforms. | | 2023 Total direct compensation Total direct compensation: $11,837,962 | | | | 2024 Base salary rate Mr. Wolk’s base salary rate increased from $1,170,000 in 2023 to $1,220,000 in 2024. |
| 10% | l | 100% vested | l | Share price
| | | | | | | 74 | | l | Ties RSU value directly to the share price | 3 years after | l | No dividend equivalents paid | grant
|
| | | | | | | | | | | | Note: Operational sales and cumulative adjusted operational EPS are non-GAAP measures. See page 54 for details | | | | | | | | | | | | | | | | | | | | John
Reed, M.D., Ph.D. Executive Vice President, Innovative Medicine R&D | Performance In addition to his contribution to our Company’s overall performance, Dr. Reed: •Accelerated innovative product development, contributing to the receipt of key regulatory approvals and program advancements. •Sharpened our focus on data science, digital health and R&D investments in oncology, immunology and neuroscience. •Delivered robust pipeline growth in Innovative Medicine, exceeding internal goals. | | 2023 Total direct compensation Total direct compensation: $8,570,385 | | | | 2024 Base salary rate Dr. Reed’s base salary rate increased from $1,150,000 in 2023 to $1,200,000 in 2024. | | 2023 New hire awards Dr. Reed assumed the role of Executive Vice President, Innovative Medicine R&D in April 2023. Upon his hire, he received a cash sign-on award of $5,700,000 to make up for compensation from his previous employer that he forfeited because he joined the Company. The value of the award was based on his forfeited: equity incentives that would have vested within 12 months of his hire date, 2022 cash annual incentive and retirement plan unvested value. Dr. Reed would need to fully repay this amount to the Company if he were to leave within the first two years of his employment. Dr. Reed also received a new hire RSU award with a target value of $11,700,000. This award replaced the $6,200,000 of forfeited equity incentives from his prior employer that would have vested more than 12 months after his hire date and $5,500,000 of annual target 2023 Johnson & Johnson equity incentives (that would have been granted in February). The award vests ratably over a three-year period and is not eligible for continued vesting after a qualifying separation. |
| | | | | | | | | | | | | | | | | | | | Jennifer
Taubert Executive Vice President, Worldwide Chairman, Innovative Medicine | Performance In addition to her contribution to our Company’s overall performance, Ms. Taubert: •Delivered robust growth worldwide that exceeded the market and competitor composite, including double digit growth on 11 key and launch brands. •Successfully launched J&J Innovative Medicine, increasing our strategic focus in oncology, immunology, neuroscience and other select disease areas and successfully integrated the global supply chain into the segment. •Advanced our portfolio and pipeline by increasing the value of launched products and line extensions and through strategic licensing and acquisitions. | | 2023 Total direct compensation Total direct compensation: $9,950,000 | | | | 2024 Base salary rate Ms. Taubert’s base salary rate increased from $1,150,000 in 2023 to $1,200,000 in 2024. |
| | | | 2018 Proxy Statement - 58
| | |
| | | | | | | | | | | | | | | | | | | | Peter
Fasolo, Ph.D.
Executive Vice President, | Performance In addition to his contribution to our Company’s overall performance, Dr. Fasolo: •Aligned our Innovative Medicine and MedTech workforces to our strategic priorities as a two-segment company. •Accelerated our talent and digital-first agenda, exceeding our pipeline health goals and further driving organizational effectiveness. •Finalized the Consumer Health separation while delivering effective transition services. | | 2023 Total direct compensation Total direct compensation: $5,777,692 | | | | 2024 Base salary rate Dr. Fasolo’s base salary rate increased from $890,000 in 2023 to $910,000 in 2024. |
MedTech chairman transition Ashley McEvoy served as Executive Vice President, Worldwide Chairman, MedTech until October 20, 2023, and served in an advisory role until she left the Company in February 2024. In consideration for her service, she earned a salary of $1,059,231 in 2023. She also was eligible for, and received, an annual incentive payment for her 2023 performance of $1,050,000. She did not receive a February 2024 LTI award for 2023 performance or any severance payments or benefits in connection with her departure. Upon termination of her employment, she forfeited outstanding long-term incentive awards that had not vested per the terms and conditions of each outstanding award.
Executive compensation decision process Importance of Our Credo values in assessing performance Since 1943, Our Credo has guided us in fulfilling our responsibilities to our patients, customers, employees, communities and shareholders. In assessing our named executive officers’ contributions to the Company's performance, the Committee not only looks to results-oriented measures of performance, but also considers how those results were achieved. It considers whether the decisions and actions leading to the results were consistent with the values embodied in Our Credo and the long-term impact of their decisions. Credo-based behavior is not something that can be precisely measured. Thus, there is no formula for how Credo-based behavior can, or will, impact an executive’s compensation. The Committee and the CEO use their judgment and experience to evaluate whether an executive’s actions were aligned with Our Credo values. Assessing "the what" and "the how" We evaluate the performance of our named executive officers based on what objectives they have accomplished and how they have accomplished them. •The “what.” We evaluate each executive against financial and strategic goals for the Company and for the business or function that they lead. •The “how." We also consider how executives accomplished their goals. This includes whether the executive achieves business results in a manner that is consistent with the values embodied in Our Credo. During the first quarter: •The Committee reviews the financial and strategic goals for the Company and each of the businesses for the current year. •The CEO provides his assessment to the Committee of “the what” and “the how” for each of the other named executive officers for the prior year. •The independent members of the Board evaluate “the what” and “the how” for the CEO for the prior year. Aligning compensation to "the what" and "the how" Our executive officers can earn from 0% to 200% of the applicable target for annual incentives and 0% to 170% for long-term incentives based on business performance and his or her individual performance on both “the what” and “the how.” This broad range allows for meaningful differentiation based on performance. The independent Directors (in the case of the CEO) and the Committee (in the case of the other named executive officers) use their judgment and experience to determine annual incentives, long-term incentives and salary rates. Performance against goals is the most significant input in determining compensation levels. However, total direct compensation is not determined in a formulaic manner. In addition, we do not consider an employee’s previous long-term incentive awards and total equity ownership when granting long-term incentive awards.
Governance of executive compensation The Committee is responsible for the executive compensation program design and decision-making process. It solicits input from the independent Directors, the CEO, other members of management and its independent compensation consultant to assist it with its responsibilities. The Committee has retained Semler Brossy Consulting Group (Semler Brossy) since May 2020 to advise the Committee on executive compensation matters. The Committee has sole authority to negotiate the terms of service, including all fees paid to any external consultants. Roles and responsibilities | | | | | | | Participant | Role | | | | Compensation & Benefits Committee | •Acts on behalf of Contents the Board by setting the principles that guide the design of our compensation and benefits programs.
•Sets the executive compensation philosophy and composition of the executive peer group.
Long-Term Incentive Vesting•Approves the compensation target levels.
•Sets compensation programs and Treatment upon Terminationprinciples that are designed to link executive pay with Company and individual performance. Our long-term incentives vest 100%•Recommends to the Board the CEO’s compensation.
•Reviews and approves compensation decisions recommended by the CEO for each of the other named executive officers. •Reviews the eligibility criteria and award guidelines for the corporate-wide compensation and benefits programs in which the named executive officers participate. | | | | | | Independent Directors | •Participate in the performance assessment process for the CEO. •Approve the CEO’s compensation. | | | | | | CEO | •Reviews and presents to the Committee the performance assessments and compensation recommendations for each of the other named executive officers. | | | | | | Independent compensation consultant | •Attends all Committee meetings at the request of the Committee. •Advises the Committee on market trends, regulatory issues and developments and how they may impact our executive compensation programs. •Reviews the compensation strategy and executive compensation programs for alignment with our strategic business objectives. •Advises on the third anniversarydesign of executive compensation programs to ensure the linkage between pay and performance. •Provides market data analyses to the Committee. •Advises the Committee on setting the CEO’s pay. •Reviews the annual compensation of the grant date. In addition, we do not pay outother named executive officers as recommended by the CEO. | | |
Independence of compensation consultant The Committee determined that Semler Brossy's services as its independent compensation consultant did not raise any conflict of interest concerns. The Committee considered the following factors, among others, when assessing the independence of its compensation consultant: •Semler Brossy did not provide any other services to the Company and reported directly to the Committee. •Semler Brossy has policies and procedures in place to prevent conflicts of interest. •No member of the Semler Brossy consulting team serving the Committee has a business or personal relationship with any member of the Committee or any executive officer of the Company. •Neither Semler Brossy nor any principal of Semler Brossy owns any shares of our common stock. •The amount of fees paid to Semler Brossy is less than 1% of its total consulting income. To assure continuing independence, the Committee periodically considers whether there should be rotation of its independent compensation consulting firm or the lead consultant. Target-setting process and pay position Before each year begins, we set compensation targets to ensure that we can compete for talent and to maintain internal equity among positions with similar responsibilities. We conduct an annual review of publicly available information and executive compensation surveys to determine current pay levels among the executive peer group. The Committee reviews market data to understand how our target pay levels compare to benchmark positions but does not target total compensation to a specific percentile of the executive peer group. Peer groups for pay and performance We use two peer groups to help determine executive compensation: •Executive peer group. We use the executive peer group to assess the competitiveness of the compensation of our named executive officers. •Competitor composite peer group. We use the competitor composite peer group to evaluate the relative performance of our Company. As described below, the two peer groups vary because executive compensation levels and practices are influenced by business complexity and company size. Most of our business competitors are smaller than Johnson & Johnson or even each of our individual businesses. Executive peer group The Committee compares our executive compensation levels and practices to those of the executive peer group companies. It consists of companies that generally are similar to Johnson & Johnson's size and scope, have executive positions similar to ours and compete with us for executive talent. The Committee reviews the composition of the executive peer group annually. We compare our salaries, annual incentives, long-term incentives, total direct compensation, benefits, perquisites and other compensation to the executive peer group companies. We do not include non-U.S. companies because comparable compensation data for the named executive officers is not available. We also do not include companies in industries whose compensation programs are not comparable to our programs, such as the financial services or oil and gas industries. The following table lists the 2023 executive peer group companies, their business characteristics and Johnson & Johnson’s rankings among these companies. Each company’s figures are for the most recent four fiscal quarters. Market capitalization is as of December 31, 2023. Johnson & Johnson ranks in the top quartile of the peers for revenue, net income and market capitalization. Effective for 2023, The Coca-Cola Company and PepsiCo, Inc. were removed and Eli Lilly and Company, Gilead Sciences, Inc. and Amgen Inc. were added, reflecting the Consumer Health separation. No changes to the group were made for 2024.
| | | | | | | | | | | | | | | | | | | | | | | | | | | | | | | Company (ticker symbol) | Revenue
($ millions) | Net income
($ millions)(1) | Market cap
($ billions)(2) | Common
industry(3) | Gross
margin
(>40%) | EBIT
margin
(>10%)(4) | Inter- national
sales
(> 33%) | Business
complexity(5) | R&D % of
sales
(>or = 5%) | 3M Company (MMM)(6) | $32,681 | $(6,995) | $60 | | | | | | | | Abbott Laboratories (ABT) | 40,109 | 5,723 | 191 | | | | | | | | Abbvie Inc. (ABBV) | 54,318 | 4,863 | 274 | | | | | | | | Amgen Inc. (AMGN) | 28,190 | 6,717 | 154 | | | | | | | AT&T Inc. (T)(7) | 122,428 | 14,400 | 120 | | | | | | | | The Boeing Company (BA) | 77,794 | (2,222) | 158 | | | | | | | | Bristol Myers Squibb Company (BMY) | 45,006 | 8,025 | 104 | | | | | | | Cisco Systems, Inc. (CSCO)(6)(8) | 57,233 | 13,442 | 205 | | | | | | | | Eli Lilly and Company (LLY) | 34,124 | 5,240 | 553 | | | | | | | | General Electric Company (GE) | 67,954 | 9,481 | 139 | | | | | | | | Gilead Sciences, Inc. (GILD) | 27,116 | 5,665 | 101 | | | | | | | | Intel Corporation (INTC) | 54,228 | 1,675 | 212 | | | | | | | Intl Business Machines Corp. (IBM)(6) | 61,860 | 7,502 | 149 | | | | | | | Medtronic plc (MDT)(8) | 32,319 | 4,201 | 110 | | | | | | | | Merck & Co., Inc. (MRK) | 60,115 | 365 | 276 | | | | | | | Microsoft Corporation (MSFT)(9) | 225,516 | 82,541 | 2,795 | | | | | | | | Pfizer Inc. (PFE) | 58,496 | 2,119 | 163 | | | | | | | The Procter & Gamble Company (PG)(9)(10) | 83,933 | 14,770 | 345 | | | | | | | | Raytheon Technologies Corporation (RTX) | 68,920 | 3,195 | 121 | | | | | | | | Johnson & Johnson (JNJ) | 85,159 | 13,326 | 377 | | | | | | | | Johnson & Johnson's Ranking | 3rd | 5th | 3rd | | | | | | | | Johnson & Johnson's Percentile Rank | 89% | 79% | 89% | | | | | | |
(1)Net income reflects net income (loss) attributable to company shareholders. (2)Market caps are derived from Bloomberg as of December 31, 2023. (3)Common industry means that the company is in an industry similar to one of Johnson & Johnson’s business segments: Innovative Medicine or MedTech. (4)Earnings before interest and tax (EBIT) is calculated as income before tax (IBT) minus net interest expense. (5)Business complexity means the company is a complex organization with multiple product lines. (6)International sales estimated for 3M Company, Cisco Systems, Inc., and IBM, as domestic sales are represented as "Americas," which may include South America or Canada. (7)Prior year data is used as an alternative for AT&T Inc. international sales and R&D spend due to lack of availability at the time of sourcing. (8)Used last four calendar quarters ending January 2024 for Cisco Systems, Inc. and Medtronic plc. (9)Used last four calendar quarters ending December 31, 2023 for Microsoft Corporation and The Procter & Gamble Company. (10)The Procter & Gamble Company's R&D spend and international sales are based on the fiscal year ended June 30, 2023 as an alternative, due to lack of availability at the time of sourcing.
Competitor composite peer group The Committee compares overall Company performance to the weighted performance of the competitor composite peer group companies. For example, when we set the sales goals for our businesses, we compare the sales of our individual businesses to the total sales of their industry competitors. For the TSR component of our PSUs, we weight the TSR within the business groups by market capitalization and weight the business groups using our sales mix each year. We include each of the peer companies in only one of the business groups in calculating the competitor composite TSR for our PSU program. These companies compete with one or more of our business segments. We evaluate the peer group on an ongoing basis and update it as necessary. We select the companies based on the following criteria and financial metrics: •Product relevance. •Financial comparison: sales growth, net income growth and margin, EPS growth and TSR. •Global presence. •Market leadership. •Strength and consistency in financial outlook. Following the separation of Kenvue in August 2023, the Consumer Health group was removed from the competitor composite peer group. The Innovative Medicine and MedTech groups remain unchanged for 2024. See "2021-2023 Performance share unit payout" on page 70 for additional details. The following table lists the 2023 competitor composite peer group companies by business. | | | | | | | | | | Innovative Medicine | MedTech | Consumer Health
(Excluded after August 2023) | •AbbVie Inc. •Amgen Inc. •AstraZeneca plc •Bristol-Myers Squibb Company •Eli Lilly and Company •GlaxoSmithKline plc •Merck & Co., Inc. •Novartis AG •Pfizer Inc. •Roche Holding Ltd* •Sanofi | •Alcon, Inc. •Bausch & Lomb Inc. •Boston Scientific Corporation •The Cooper Companies, Inc •Intuitive Surgical, Inc. •Medtronic plc •Smith & Nephew plc •Stryker Corporation •Zimmer Biomet Holdings, Inc. | •Beiersdorf AG •Bayer AG** •Colgate-Palmolive Company •Haleon plc •L'Oréal S.A. •The Procter & Gamble Company •Reckitt Benckiser Group plc •Sanofi** •Unilever plc |
* Pharm Sales, SG&A, R&D and Operating Profit only ** OTC Sales only
Additional information concerning executive compensation No employment agreements with named executive officers Our Severance Pay Plan provides benefits to certain full-time U.S. employees who are involuntarily terminated. We provide two weeks base salary for each year of service, with guaranteed minimums based on an employee’s level. The minimum for our named executive officers is 52 weeks of base salary. We pay severance according to our normal payroll cycle. We do not pay severance as a lump-sum payment. We do not have employment arrangements or agreements with any of our named executive officers.
Use of tally sheets The Committee reviews tally sheets, prepared by management and reviewed by the Committee’s independent compensation consultant, for each of our named executive officers. These tally sheets include all the Company’s obligations for compensation and benefits under hypothetical termination scenarios. The Committee does not use the tally sheets to determine the various elements of compensation or the actual amounts of compensation to be approved, but instead uses the tally sheets to evaluate the Company’s obligations under the plans. Non-competition and non-solicitation Long-term incentive awards are subject to forfeiture and repayment provisions if an employee violates non-competition or non-solicitation agreements, as follows: | | | | | | | Competition with the Company | Impact on long-term incentive awards | •Violating the non-competition provisions of the award agreement during employment or within 18 months of termination and/or •Violating any other non-competition or non-solicitation agreement an employee has with the Company. | •Forfeit vested and unvested PSUs, until we determineoptions and RSUs and •Repay any PSUs or RSUs vested or options exercised within the 12 months prior to the violation. |
Long-term incentive vesting and treatment upon termination Beginning with the February 13, 2023 grant, options and RSUs vest one-third per year on each of the first, second and third anniversaries of the grant date. Options and RSUs granted before February 13, 2023 are 100% vested on the third anniversary of the grant date. Our PSUs continue to vest 100% on the third anniversary of the grant date. In addition, we do not pay out our PSUs until we determine the percent of target PSUs that have been earned based on performance.
The treatment of our long-term incentives upon termination varies depending on the termination circumstances, as follows: | | | | | | | | | | | | | | | | | | | | | | | | | Termination | Eligibility | Eligible named executive officers | Voluntary termination | Involuntary termination without cause | Involuntary termination with cause | Death | Disability | | Qualifying separation | •Termination of employment at age 62 or later, or •Termination of employment after attainment of age 55 and at least 10 years of service with at least 5 years of consecutive service immediately before termination of employment. | J. Duato J. Wolk J. Reed J. Taubert P. Fasolo | •Grants within six months prior to termination would be forfeited. •Other equity awards would become vested on their normal vesting dates. •Options would remain exercisable for their remaining terms. | •All vested and unvested equity awards would be forfeited. | •All equity awards would become vested on the termination circumstances as follows:date. | | | | | | | | | | | | | Termination | Eligibility | Eligible Named Executive Officers | Voluntary
Termination
| Involuntary
Termination
Without
Cause
| Involuntary
Termination
with
Cause
| Death | Disability | Qualifying Separation | l | Termination of employment at age 62 or later, or | Gorsky
Caruso
Duato
Stoffels
| l | Grants within 6 months prior to termination would be forfeited. | l | All vested and unvested equity awards would be forfeited. | l | All equity awards would become vested on the termination date. | l | Termination of employment after attainment of age 55 and at least 10 years of service with at least 5 years of consecutive service immediately before termination of employment.
| l | Other equity awards would become vested on their normal vesting dates. | l | Options would remain exercisable for their remaining terms.
| l | Options would remain exercisable for their remaining terms.
| l | Accelerated PSUs would be paid out at 100% of target with a “top up” at the end of the performance period if the payout exceeds target.
| Non-Qualifying Separation (age 55-61) | l | Termination of employment after attainment of age 55, but before age 62 and without meeting the service requirements for Qualifying Separation. | Peterson | l | All unvested equity incentives would be forfeited. | l | Vested options would remain exercisable for up to three years.
| Non-Qualifying Separation (Under age 55) | l | Termination of employment before attainment of age 55. | | l | All unvested equity incentives would be forfeited. | l•Options would remain exercisable for their remaining terms.•Accelerated PSUs would be paid out at 100% of target with a “top up” at the end of the performance period if the payout exceeds target. | Non-qualifying separation
(age 55-61) | •Termination of employment after attainment of age 55 but before age 62 and without meeting the service requirements for qualifying separation. | | •All unvested equity incentives would be forfeited. •Vested options would remain exercisable for up to three years. | | Non-qualifying separation
(Under age 55) | •Termination of employment before attainment of age 55. | A. McEvoy
| •All unvested equity incentives would be forfeited. •Vested options would remain exercisable for up to three months. | |
Note: Dr. Reed's May 2023 new hire RSU award vests ratably over a three-year period and is not eligible for continued vesting after a qualifying separation.
Involuntary termination due to specified divestiture or reduction in force •Specified divestiture. A divestiture where the acquirer does not replace the awards that would be forfeited. •Reduction in force. A termination of employment due to position elimination or plant closing. Beginning with the February 13, 2023 long-term incentive award, RSUs and options are no longer prorated in the event of a specified divestiture or reduction in force. Long-term incentive awards granted prior to that date will be prorated and vested in the event of a specified divestiture or reduction in force, and PSU awards will continue to be pro-rated, as follows: •Proration. Awards would be prorated in proportion to the time worked during the vesting period. •Vesting. PSU and RSU awards would become available on their normal vesting dates. Option vesting would be accelerated as of the date of termination and the options would remain exercisable for up to three months. •Coordination with qualifying separations. If an employee’s termination is also a qualifying separation, any of the employee’s awards that would have been forfeited because they were granted within six months prior to termination would receive the pro-ration and vesting treatment described above. Compensation policies and practices Stock ownership guidelines for named executive officers We require our named executive officers to own our Company’s stock to further align their interests with our shareholders’ interests. The named executive officers must meet the following requirements: | | | | | | | | | | | | | | | | | | | Name | | Stock ownership and guideline as a multiple of base salary | | 2023 Compliance with stock ownership guidelines | Ownership threshold met(1) | | J. Duato | | | | Yes | Yes | | J. Wolk | | | | Yes | Yes | | J. Reed | | | | Yes | Yes | | J. Taubert | | | | Yes | Yes | | P. Fasolo | | | | Yes | Yes |
Changes for Long-Term Incentives Granted in 2018(1)Executive officers have five years after first becoming subject to the guidelines to achieve the required ownership thresholds. Each of our continuing named executive officers was in compliance with our stock ownership requirement as of January 1, 2024. Ms. McEvoy stepped down as Executive Vice President, Worldwide Chairman MedTech in October 2023 and was compliant as of October 20, 2023. We believe the ownership levels in the graph above illustrate our senior executives' commitment to our Company and our shareholders. We do not count shares underlying options or unearned PSUs as owned shares for these guidelines. A named executive officer cannot sell the after-tax shares received from long-term incentives until his or her ownership threshold is met. The Nominating & Corporate Governance Committee monitors compliance with these guidelines on an annual basis. •Non-Competition and Non-Solicitation: Long-term incentive awards granted in 2018 are subject to enhanced forfeiture and repayment provisions if an employee violates non-competition or non-solicitation agreements as follows:
Policy against pledging, hedging and short selling Our Policy Against Pledging, Hedging and Short Selling of Company Stock prohibits directors and executive officers from pledging, entering into hedging arrangements, short selling or transacting in derivative instruments linked to the performance of the Company’s stock. Executive compensation recoupment policies The Company has adopted various compensation recoupment and clawback policies that authorize or require the Board to recoup compensation paid to executive officers or other senior executives in certain circumstances. Under these policies, the Board is authorized to recoup (1) compensation paid to an executive officer that was based upon the achievement of financial results that were subsequently materially restated or (2) compensation paid to senior executives in the event of significant misconduct resulting in a violation of a significant Company policy, law or regulation relating to manufacturing, sales or marketing of products that causes material harm to the Company. In addition, under the policy adopted by the Company to comply with the final clawback rules issued by the SEC in 2022, certain incentive-based compensation awarded to covered executive officers is subject to mandatory recovery if the Company is required to prepare an accounting restatement. The recovery of such compensation applies regardless of whether the covered executive officer engaged in misconduct or otherwise caused an accounting restatement requirement. Under this policy, the Board may recoup incentive-based compensation received within a lookback period of the three completed fiscal years immediately preceding the date on which the Company is required to prepare an accounting restatement. The Company will disclose in its Proxy Statement any actions to recover compensation under this policy during or following the end of the most recently completed fiscal year. These policies are available for review at www.investor.jnj.com/governance/corporate-governance-overview/compensation-recoupment-policies. Tax impact on compensation We consider objectives such as attracting, retaining and motivating leaders when we design our executive compensation programs. We also consider the tax-deductibility of compensation, but it is not our sole consideration. Given the limitations on deductibility of compensation for our named executive officers imposed as a result of U.S. tax reform in 2017, we expect that tax deductibility will have less of an impact on our program design for our named executive officers than in previous years. For federal income taxes, compensation is an expense that is fully tax-deductible for almost all our U.S. employees. Following the 2017 tax reform, annual compensation in excess of $1 million paid to our named executive officers who are covered employees under Section 162(m) of the Internal Revenue Code will generally not be tax deductible, even if such compensation is performance-based or paid following termination of employment. The 2017 tax reform legislation includes a “grandfather rule” under which compensation payable pursuant to a written binding contract that was in effect on November 2, 2017 will remain tax deductible for U.S. federal income tax purposes. We generally expect to preserve the grandfathered status of any of our plans or awards (or portions thereof) that qualify for such status. Compensation decisions for 2022 performance The following compensation figures included in this year’s summary compensation table were granted to the named executive officers in February 2023 for performance in 2022: •2023 PSU and RSU awards included in the stock awards column. •The 2023 option award included in the option awards column. The decisions regarding these awards were discussed in detail in our 2023 Proxy Statement dated March 15, 2023. For a full understanding of these decisions, please refer to the section of our 2023 Proxy Statement entitled Compensation Discussion and Analysis — Compensation Decisions for 2022 Performance. | | | | | | | 2024 Proxy Statement | 85 | | | | | Competition with the Company | Impact on Long-Term Incentive Awards | l | Violating the non-competition provisions of the award agreement during employment or within 18 months of termination. | l | Forfeit vested and unvested PSUs, options, and RSUs. | l | Violating any other non-competition or non-solicitation agreement an employee has with the company. | l | Repay any PSUs or RSUs vested or options exercised within the 12 months prior to the violation. |
Reconciliation of non-GAAP performance measures | | | | | | | | | | | | | | | | | | | | | | | | | Details on 2023 annual incentive non-GAAP performance measures | | | | | | | | | | | | Involuntary Termination•Operational sales growth. Operational sales growth is the sales change due to Specified Divestiturechanges in volume and price, excluding COVID-19 vaccine sales and the effect of currency translation. Any unbudgeted acquisition or Reductiondivestiture, as well as any accounting change that would impact sales by more than 0.5% would be excluded. The following is a reconciliation of operational sales to reported sales (the most directly comparable GAAP measure).
| | | | | | | | | | | ($ millions) | | | | 2023 Reported Sales | | $85,159 | | | | COVID-19 Vaccine Sales | | (1,117) | | | | Currency Translation | | 770 | | | | 2023 Operational Sales | | 84,812 | | | | | | •Free cash flow. Free cash flow is the cash flow from operating activities less additions to property, plant and equipment. Any unbudgeted significant acquisition, divestiture, change in Force: Long-termaccounting rule, change in tax laws, and special item and intangible amortization expense would be excluded if it impacted adjusted operational EPS by more than 1%. For 2023 annual incentive awards grantedpurposes, we adjusted Enterprise free cash flow downward approximately $3.2 billion to remove the impact of budgeted litigation-related payments and budgeted tax matter payments that did not occur in 20182023. Adjustments were also made for significant currency fluctuations above normal levels and other items. The figures are pro-ratedrounded for display purposes. | | | | | | | | | | | ($ millions) | | | | Cash flow from operating activities | | $22,791 | | | | Additions to property, plant and equipment | | (4,543) | | | | Free cash flow | | 18,248 | | | | Budgeted litigation-related and tax matter payments | | (3,243) | | | | Currency translation | | (416) | | | | Other adjustments | | (392) | | | | Adjusted free cash flow | | 14,197 | | | | | | | |
| | | | | | | | | | | | | | | | | | | | | | | | | Details on 2023 annual incentive non-GAAP performance measures | | | | | | | | | | | | •Adjusted operational EPS growth. Adjusted EPS and adjusted operational EPS are non-GAAP financial measures. •See Exhibit 99.1 to the Company’s Current Report on Form 8-K dated January 23, 2024 and Reconciliation of Non-GAAP Financial Measures in our 2023 Annual Report included in our proxy materials for a breakout of special items and intangible amortization expense. •Adjusted operational EPS growth also excludes the effect of currency translation. Any unbudgeted significant acquisition, divestiture, change in accounting rule, change in tax laws and share repurchases would be excluded if it impacted adjusted operational EPS by more than 1%. •Below is a reconciliation of diluted EPS (the most directly comparable GAAP measure) to adjusted EPS and adjusted operational EPS. | | | | | | | | | | | 2023 $ per share | | | | Diluted EPS as reported | | $5.20 | | | | Special items and intangible amortization expense | | 4.72 | | | | Adjusted EPS | | 9.92 | | | | Currency Translation | | (0.03) | | | | Other unbudgeted adjustments, including Kenvue share impact | | (0.37) | | | | Adjusted operational EPS | | 9.52 | | | | |
| | | | | | | | | | | | | | | | | | | | | Details on 2021-2023 PSU non-GAAP performance measures | | | | | | | | | | 2021-2023 Cumulative adjusted operational EPS performance. The following is a reconciliation of 2021-2023 cumulative reported EPS to cumulative adjusted operational EPS. | | | | | | | | | $ | | | Reported EPS | | $19.74 | | | Special items and intangible amortization expense | | 10.13 | | | Adjusted EPS | | 29.87 | | | Currency translation | | 0.75 | | | Plan adjustments | | 0.00 | | | Adjusted operational EPS | | 30.62 | | | | | | See Exhibit 99.1 to the Company’s Current Report on Form 8-K dated January 23, 2024 and Reconciliation of Non-GAAP Financial Measures in our 2023 Annual Report included in our proxy materials for a breakout of special items and intangible amortization expense. EPS for 2021 and 2022 was not recasted for the Consumer Health separation for PSU purposes. For 2023, adjusted EPS is for continuing operations (and does not include Consumer Health). For 2021 and 2022 EPS, see Exhibit 99.1 to the Company's Current report on Form 8-K dated January 24, 2023, and Reconciliation of Non-GAAP Financial Measures in our 2022 Annual Report included in our proxy materials for a breakout of special items and intangible amortization expense. Adjusted operational EPS excludes the impact of special items, intangible amortization expense and currency translation. Any unbudgeted significant acquisition, divestiture, change in accounting rule, change in tax laws and share repurchases would be excluded if it impacted adjusted operational EPS by more than 1% in that year or the following year. There were no net plan adjustments for the 2021-2023 PSU performance period. | | | | | | | | 2021-2023 Relative TSR performance (calculated using trailing 20-day average closing stock prices) | | | | | | | | TSR from January 1, 2021 to December 31, 2023 | % | | | Johnson & Johnson | 3.4 | % | | | Competitor composite peer group | 8.1 | | | | Relative TSR performance (Johnson & Johnson minus competitor composite) | (4.7) | | | | | | | | | In connection with the separation of our Consumer Health business in August 2023, the competitor composite peer group was modified to remove the Consumer Health peers beginning in August 2023. See "Competitor composite peer group" on page 81 for additional details. | | | | | | |
Executive compensation tables Reconciliation of our CEO's 2023 total direct compensation to the 2023 summary compensation table Compensation decisions for 2023 performance In January and February of each year, we assess the performance of each of our named executive officers and we determine the annual incentive earned for the prior year's performance, long-term incentive award granted in the first quarter of the year based on the prior year's performance and salary rate for the upcoming year. We consider an executive's total direct compensation for a year to be the sum of salary earned during the year, annual incentive earned for that year's performance and long-term incentive award granted in the first quarter of the following year based on that year's performance. Differences between total direct compensation and the total from the summary compensation table In the graph and table on page 90, we show the 2023 total direct compensation for our Chairman and CEO shown on page 60, the total from the summary compensation table (SCT) on page 92 and the differences between the two amounts. We also show the reconciliations for 2022 and 2021 in the table. What we consider total direct compensation for a given year differs from the total in the summary compensation table in the following respects: •Long-term incentive (LTI) timing and accounting differences. •LTI timing difference. We consider an executive's LTI award granted based on a year's performance to be part of his or her total direct compensation for that year along with his or her salary earned during that year and annual incentive earned for that year's performance. In contrast, the summary compensation table total includes LTI granted during the year – not the LTI granted based on that year's performance. Since we vary the size of our LTI awards based on performance in the prior year, this timing difference results in differences that obscure the decisions of the Committee to align pay with performance for a given year. For example, the LTI awards granted on February 15, 2024 based on 2023 performance are included in our named executive officers' 2023 total direct compensation. However, the summary compensation table's 2023 totals include amounts granted in 2023 (based on 2022 performance). •LTI accounting difference. The per-unit value used to determine the number of PSUs granted assumes 100% of target performance is achieved. This PSU unit value can be lower or higher than the value included in the summary compensation table. The difference is due to the TSR-based part of the PSUs being valued at more or less than 100% of target performance according to U.S. accounting rules. In connection with the separation of Kenvue in August 2023, the Committee determined that the TSR goals for the 2021-2023, 2022-2024 and 2023-2025 PSU awards should be modified to remove the Consumer Health peers following the final separation of Kenvue. The incremental compensation expense for the modification is included in the 2023 SCT but is not considered part of TDC. •Change in pension present value. The pension is only paid after retirement and we do not consider it to be part of total direct compensation for any given year. In contrast, the summary compensation table total includes positive changes in the present value of an executive's pension benefit during the year. On pages 91 and 95 we show the breakout of the impacts of service, pay and age and changes in assumptions on our named executive officers' changes in pension values. The "noise" created by changes in assumptions introduces significant year-over-year volatility to our summary compensation table totals and does not reflect decisions on compensation by the Committee.
•Other. We do not include amounts related to our legacy cash-based long-term incentives and benefits and perquisites in total direct compensation for a year. However, these amounts are included in the summary compensation table total as follows: •Legacy cash-based long-term incentives. Dividend equivalent payments on, and the growth in value above a reference rate of, our legacy cash-based long-term incentive plans (included in columns G and H). We stopped granting cash-based long-term incentives in 2012. •Benefits and perquisites. Perquisites and other personal benefits, Company contributions to our 401(k) and Excess Savings Plans and insurance premiums (included in column I). 2023 CEO total direct compensation vs. summary compensation table reconciliation
($ millions)
| | | | | | | | | | | | | Reconciliation: CEO TDC to summary compensation table total | 2021 | 2022 | 2023 | | Total direct compensation | $10,430,000 | $19,870,962 | $21,634,615 | | LTI timing & accounting differences | 1,665,279 | (7,730,212) | (420,867) | | Change in pension present value (included in SCT column H) | 841,000 | 0 | 6,213,000 | | Other items (included in SCT columns G, H and I) | 869,013 | 958,737 | 970,492 | | Total from summary compensation table (included in SCT column J) | 13,805,292 | 13,099,487 | 28,397,240 |
| | | | | | | | | | | | | CEO compensation: LTI timing & accounting differences | 2021 | 2022 | 2023 | | LTI value included in total direct compensation | $7,730,000 | $15,990,000 | $16,400,000 | | Value of timing differences | 250,000 | (8,260,000) | (410,000) | | Value of accounting differences | 1,415,279 | 529,788 | (10,867) | | LTI value included in summary compensation table | 9,395,279 | 8,259,788 | 15,979,133 |
Change in pension value In the graph and table below, we show the breakout of the impacts of service, pay, age and changes in assumptions on our CEO's change in pension value. On page 95 we show the same breakout for each of our named executive officers. It is important to "separate the signal from the noise" in the change in pension present value. The "noise" created by changes in assumptions that are beyond our control introduces significant year-over-year volatility to the summary compensation table totals and does not reflect decisions on compensation by the Committee. Service, pay and age. The "signal" is fairly stable year-over-year. As shown in the graph and table, the change in present value due to service, pay and age is fairly stable year-over-year. These factors increase the present values of an executive's pension and are features of the plan's design. •Service. Each additional year of service increases the pension benefits. •Five-year average pay. Increases in an executive's five-year average pay increase the pension benefits. •Age. Each year an executive is one year closer to retirement results in an increase in the present value solely due to the passage of time. Changes in assumptions. The "noise" introduces significant year-over-year volatility. As shown in the graph and table, changes in assumptions regarding mortality and interest rates introduce significant year-over-year volatility to the change in present value and the summary compensation table totals. These variables are beyond our control and are not design features of the plan. | | | | | | | | | | | | | Change in CEO pension present value ($) | 2021 | 2022 | 2023 | | Impact of service, pay and age | $1,812,000 | $4,079,000 | $5,613,000 | | Impact of change in assumptions | (971,000) | (6,245,000) | 600,000 | | Total change in pension value | 841,000 | (2,166,000) | 6,213,000 |
CEO Change in pension value: 2021-2023
($ millions) | | | | | | | | | | | | | | | | | | | — | | Service, pay, and age | — | | Change in assumptions | — | | Total |
2023 Summary compensation table In the table below, we show the compensation of our Chief Executive Officer, Chief Financial Officer and the three other most highly compensated executive officers for 2023. We also show the compensation of one of our former executive officers who served for part of 2023. We show the compensation of executive officers listed in the table below for 2022 and 2021 if they were also named in the 2023 and 2022 Proxy Statements. For a complete understanding of the table, please read the descriptions of each column that follow the table. | | | | | | | | | | | | | | | | | | | | | | | | | | | | | | | A | B | C | D | E | F | G | H | I | J | Name and
principal position | Year | Salary
($) | Bonus
($) | Stock awards
($) | Option
awards
($) | Non-equity
incentive plan
compensation
($) | Change in
pension
value and
non-qualified
deferred
compensation
earnings
($) | All other
compensation
($) | Total
($) | J. Duato Chairman/CEO | 2023 | $1,584,615 | $0 | $11,182,143 | $4,796,990 | $4,378,500 | $6,213,000 | $241,992 | $28,397,240 | | 2022 | 1,490,962 | 0 | 5,940,829 | 2,318,959 | 3,079,750 | 0 | 268,987 | 13,099,487 | | 2021 | 1,030,000 | 0 | 7,001,281 | 2,393,998 | 2,319,450 | 875,767 | 184,796 | 13,805,292 | J. Wolk EVP, CFO | 2023 | 1,147,962 | 0 | 5,766,005 | 2,460,014 | 1,928,800 | 2,514,000 | 98,072 | 13,914,853 | | 2022 | 1,008,462 | 0 | 4,718,897 | 1,841,952 | 1,177,800 | 0 | 75,971 | 8,823,082 | | 2021 | 938,077 | 0 | 4,877,538 | 1,688,997 | 1,560,863 | 1,809,897 | 78,243 | 10,953,615 | J. Reed EVP, Innovative Medicine, R&D | 2023 | 840,385 | 5,700,000 | 11,699,934 | 0 | 1,720,000 | 374,000 | 313,031 | 20,647,350 | J. Taubert EVP, WWC Innovative Medicine | 2023 | 1,130,000 | 0 | 4,246,820 | 1,799,992 | 1,896,250 | 1,844,000 | 78,332 | 10,995,394 | | 2022 | 1,008,462 | 0 | 4,764,921 | 1,859,958 | 1,094,875 | 0 | 53,316 | 8,781,532 | | 2021 | 938,077 | 0 | 4,947,245 | 1,713,005 | 1,510,314 | 1,067,411 | 49,707 | 10,225,759 | P. Fasolo EVP, Chief Human Resources Officer | 2023 | 877,692 | 0 | 2,999,620 | 1,277,991 | 1,160,000 | 1,076,000 | 110,744 | 7,502,047 | A. McEvoy Former EVP, WWC MedTech | 2023 | 1,059,231 | 0 | 4,015,750 | 1,707,004 | 1,261,500 | 1,312,000 | 47,665 | 9,403,150 | | 2022 | 984,615 | 0 | 3,935,021 | 1,535,967 | 890,250 | 0 | 44,308 | 7,390,161 |
Note: EVP means Executive Vice President. WWC means Worldwide Chairman. Salary (column C) Column C includes the base salaries paid for the year. Bonus (column D) Column D includes the cash sign-on award paid to Dr. Reed to make up for compensation from his previous employer that he forfeited because he joined the Company. The value of the award was based on his forfeited equity incentives that would have vested within 12 months of his hire date, 2022 cash annual incentive and retirement plan unvested value. Dr. Reed would need to fully repay this amount to the Company if he were to leave within the first two years of his employment. Stock awards (column E) Column E includes the grant date fair value of performance share unit and restricted share unit awards. It also includes the accounting expense for the 2021-2023, 2022-2024 and 2023-2025 PSUs that were considered modified for accounting purposes because the Consumer Health peers were removed from the TSR calculations following the final separation of our Consumer Health business in August 2023. No additional PSUs were granted as a result of the modification. See 2023 Grants of plan-based awards on page 98 for details on 2023 awards.
For Mr. Duato, there is a significant increase in value from 2022 to 2023 as a result of his promotion from Vice Chair to CEO in January 2022. His stock awards in 2023 were based on the Committee's assessment of his 2022 performance as CEO. His stock awards in 2022 were based on the Committee's assessment of his 2021 performance as Vice Chair. For Dr. Reed, column E includes the number of RSUs granted to him in May 2023 following his hire. This award replaced the $6.2 million of forfeited equity incentives from his prior employer that would have vested more than 12 months after his hire date and $5.5 million of annual target 2023 Johnson & Johnson equity incentives (that would have been granted in February). The award vests ratably over a three-year period and is not eligible for continued vesting after a qualifying separation. This table details the number and value of the PSUs assuming achievement at threshold, target and maximum performance (at 200%). | | | | | | | | | | | | | | | | | | | | | | | | | | | | Name | Award | Performance share units | | Units | | Grant date fair value | Threshold
(#) | Target
(#) | Maximum
(#) | | Threshold
($) | Target
($) | Maximum
($) | | J. Duato | 2023-2025 PSU | 0 | 64,308 | 128,616 | | $0 | $9,335,592 | $18,671,185 | | J. Wolk | 2023-2025 PSU | 0 | 32,978 | 65,956 | | 0 | 4,787,416 | 9,574,833 | | J. Taubert | 2023-2025 PSU | 0 | 24,130 | 48,260 | | 0 | 3,502,952 | 7,005,904 | | P. Fasolo | 2023-2025 PSU | 0 | 17,133 | 34,266 | | 0 | 2,487,198 | 4,974,395 | | A. McEvoy | 2023-2025 PSU | 0 | 22,884 | 45,768 | | 0 | 3,322,070 | 6,644,141 |
Option awards (column F) Column F includes the grant date fair value of option awards. See 2023 Grants of plan-based awards on page 98 for details on 2023 awards. For Mr. Duato, there is a significant increase in value from 2022 to 2023 as a result of his promotion from Vice Chair to CEO in January 2022. His option awards in 2023 were based on the Committee's assessment of his 2022 performance as CEO. His option awards in 2022 were based on the Committee's assessment of his 2021 performance as Vice Chair. Non-equity incentive plan compensation (column G) Column G includes the annual incentive and dividend equivalents received on vested certificates of long-term compensation (CLCs) and certificates of long-term performance (CLPs). •Annual incentives. The Board and Committee approved the annual incentives after reviewing performance for the year. We determine the size of annual incentive payouts and pay them out in the first quarter of the year following the performance year. •CLCs and CLPs. We stopped granting CLCs and CLPs in 2012. These cash-based long-term incentives have all vested and will be paid out in accordance with their original terms. All the remaining CLPs for our named executive officers were paid out in March 2022 and there are none currently outstanding. The values of CLCs and CLPs are included in several tables in this Proxy Statement. The: •Non-equity incentive plan compensation column of the summary compensation table includes the dividend equivalents paid on vested CLCs and CLPs. •Change in pension value and non-qualified deferred compensation earnings column of the summary compensation table includes the annual change in value of any vested CLCs and CLPs, but only to extent that the unit values grow at a rate that exceeds a reference rate of return. •Non-qualified deferred compensation table on page 107 includes the value of vested CLCs that have not been paid out.
The following table details the amounts included in column G. Non-equity incentive plan compensation | | | | | | | | | | | | | | | | | | | Name | Year | Annual incentive
($) | Value of CLC dividend equivalents earned
during the fiscal year
($) | Value of CLP dividend equivalents earned
during the fiscal year
($) | Total
($) | | J. Duato | 2023 | $3,650,000 | $728,500 | $0 | $4,378,500 | | 2022 | 2,390,000 | 689,750 | 0 | 3,079,750 | | 2021 | 1,670,000 | 649,450 | 0 | 2,319,450 | | J. Wolk | 2023 | 1,910,000 | 18,800 | 0 | 1,928,800 | | 2022 | 1,160,000 | 17,800 | 0 | 1,177,800 | | 2021 | 1,540,000 | 16,760 | 4,103 | 1,560,863 | | J. Reed | 2023 | 1,720,000 | 0 | 0 | 1,720,000 | | J. Taubert | 2023 | 1,720,000 | 176,250 | 0 | 1,896,250 | | 2022 | 928,000 | 166,875 | 0 | 1,094,875 | | 2021 | 1,340,000 | 157,125 | 13,189 | 1,510,314 | | P. Fasolo | 2023 | 1,160,000 | 0 | 0 | 1,160,000 | | A. McEvoy | 2023 | 1,050,000 | 211,500 | 0 | 1,261,500 | | 2022 | 690,000 | 200,250 | 0 | 890,250 |
Change in pension value and non-qualified deferred compensation earnings (column H) Column H includes the increase in the present value of the accrued pension benefit and the above-reference-rate non-qualified deferred compensation earnings. The table below shows the change in pension values and above-reference-rate amounts for vested CLCs. Change in pension value and non-qualified deferred compensation earnings | | | | | | | | | | | | | | | | Name | Fiscal
year | Change in
pension value
($) | Above reference-
rate calculation
for vested CLCs
($) | Total
($) | | J. Duato | 2023 | $6,213,000 | $0 | $6,213,000 | | 2022 | 0 | 0 | 0 | | 2021 | 841,000 | 34,767 | 875,767 | | J. Wolk | 2023 | 2,514,000 | 0 | 2,514,000 | | 2022 | 0 | 0 | 0 | | 2021 | 1,809,000 | 897 | 1,809,897 | | J. Reed | 2023 | 374,000 | 0 | 374,000 | | J. Taubert | 2023 | 1,844,000 | 0 | 1,844,000 | | 2022 | 0 | 0 | 0 | | 2021 | 1,059,000 | 8,411 | 1,067,411 | | P. Fasolo | 2023 | 1,076,000 | 0 | 1,076,000 | | A. McEvoy | 2023 | 1,312,000 | 0 | 1,312,000 | | 2022 | 0 | 0 | 0 |
Change in pension value The change in pension present value is not a current cash payment. The pensions are only paid after retirement. See 2023 Pension benefits on page 105 for details on the pension. See Note 10 to the Consolidated Financial Statements of the 2023 Form 10-K for details on the discount rate. •Impact of service, pay and age. The following factors increased the present values: •Service. An additional year of completed service was included in the calculation of benefits. •Five-year average pay. The five-year average pay increased since the previous fiscal year-end. •Age. Each executive is one year closer to the age when we assume the pension payments will begin. •Impact of changes in assumptions. The change in present value is highly sensitive to changes in mortality and interest rate assumptions which can increase or decrease the values. The following table details the changes in actuarial assumptions and their net effect on the change in pension value. Effect of change in actuarial assumptions on pension present value | | | | | | | | | | | | | Year | Mortality table | Discount rate | Net effect of
changes on pension
present value | | 2023 | PRI-2012 table, generational mortality projection with scale MMP-2021 | 5.16 | % | Increase | | 2022 | PRI-2012 table, generational mortality projection with scale MMP-2021 | 5.42 | % | Decrease | | 2021 | PRI-2012 table, generational mortality projection with scale MMP-2021 | 2.89 | % | Decrease | | 2020 | PRI-2012 table, generational mortality projection with scale MMP-2019 | 2.55 | % | N/A |
In the table below, we show the 2021-2023 changes in pension value and the impacts of: service, pay and age; and changes in assumptions. Negative figures are not included in the summary compensation table (according to SEC rules). Change in pension value | | | | | | | | | | | | | | | | | | | Name | Year | Impact of service,
pay and age
($) | Impact of changes
in assumptions
($) | Total change in
pension value
($) | Amount reported
in summary
compensation table
($) | | J. Duato | 2023 | $5,613,000 | $600,000 | $6,213,000 | $6,213,000 | | 2022 | 4,079,000 | (6,245,000) | (2,166,000) | 0 | | 2021 | 1,812,000 | (971,000) | 841,000 | 841,000 | | J. Wolk | 2023 | 2,174,000 | 340,000 | 2,514,000 | 2,514,000 | | 2022 | 2,249,000 | (3,651,000) | (1,402,000) | 0 | | 2021 | 2,365,000 | (556,000) | 1,809,000 | 1,809,000 | | J. Reed | 2023 | 374,000 | 0 | 374,000 | 374,000 | | J. Taubert | 2023 | 1,626,000 | 218,000 | 1,844,000 | 1,844,000 | | 2022 | 1,218,000 | (2,376,000) | (1,158,000) | 0 | | 2021 | 1,430,000 | (371,000) | 1,059,000 | 1,059,000 | | P. Fasolo | 2023 | 947,000 | 129,000 | 1,076,000 | 1,076,000 | | A. McEvoy | 2023 | 1,013,000 | 299,000 | 1,312,000 | 1,312,000 | | 2022 | 1,020,000 | (3,617,000) | (2,597,000) | 0 |
Above-reference-rate non-qualified deferred compensation earnings Any above-reference-rate returns on vested CLCs are deferred and not paid in the current year. •The change in the values of the CLCs depends on our long-term operational performance. •We use 120% of the December applicable federal long-term interest rate (AFR) as the reference rate. •Negative figures are not included in the summary compensation table (according to SEC rules). The following table details the calculation of the above-reference-rate returns on CLCs. | | | | | | | Above-reference-rate return | CLC | | Beginning of year unit value | $52.90 | | End of year unit value | $53.76 | | Change in unit value ($) | $0.86 | | Change in unit value (%) | 1.63 | % | | Reference-rate | 6.05 | % | | Above-reference-rate return | (4.42) | % | Above reference-rate return included in the eventsummary compensation table | 0.00 | % |
All other compensation (column I) Column I includes the 2023 value of perquisites and other personal benefits, tax reimbursements, Company contributions to our 401(k) and Excess Savings Plans, and insurance premiums. Details for 2022 and 2021 are included in our 2023 and 2022 Proxy Statements (dated March 15, 2023 and March 16, 2022, respectively). | | | | | | | | | | | | | | | | | | | Name | Perquisite and other
personal benefits
($) | Tax
reimbursements
($) | Registrant
contributions
to defined
contribution plans
($) | Insurance
premiums
($) | Total
($) | | J. Duato | $170,684 | $0 | $71,308 | $0 | $241,992 | | J. Wolk | 38,807 | 0 | 51,658 | 7,607 | 98,072 | | J. Reed | 249,271 | 34,363 | 29,397 | 0 | 313,031 | | J. Taubert | 19,165 | 0 | 50,850 | 8,317 | 78,332 | | P. Fasolo | 61,687 | 0 | 39,496 | 9,561 | 110,744 | | A. McEvoy | 0 | 0 | 47,665 | 0 | 47,665 |
Note: Ms. McEvoy's total perquisites and other personal benefits amounted to less than $10,000.
| | | | | Details on all other compensation | | | 2023 Perquisites and other personal benefits and tax reimbursements detail J. Duato. $170,684, which includes personal use of corporate aircraft of $145,685 and personal use of a Specified Divestiture or Reductioncompany car and driver. J. Wolk. $38,807, which includes personal use of corporate aircraft of $27,422, personal use of a company car and driver, and home security-related costs. J. Reed. $249,271,which includes personal use of corporate aircraft of $182,850, personal use of a company car and driver, and $58,226 in Force as follows: | | ◦ | Pro-ration: Awards would be prorated in proportion to the time worked during the vesting period.
|
| | ◦ | Vesting: PSU and RSU awards would become available on their normal vesting dates. Stock option vesting would be accelerated as of the date of termination and the options would remain exercisable for up to three months.
|
| | ◦ | Coordination with Qualifying Separations: If an employee’s termination is also a Qualifying Separation, the employee’s awards would receive the better of the Qualifying Separation or the pro-ration treatments.
|
| | ◦ | Specified Divestiture: A Specified Divestiture is a divestiture where the acquirer does not replace the awards that would be forfeited.
|
| | ◦ | Reduction in Force: A Reduction in Force is a termination of employment due to position elimination or plant closing.
|
relocation expenses.
As part of our standard executive relocation package, Dr. Reed was provided with airfare between his current home and the Company's offices, a corporate apartment and an insured automobile. These expenses are only available to him within his first 12 months of hire. | | | | | | 2018 Proxy Statement - 59
|
J. Taubert. $19,165, which includes personal use of company car and driver and home security-related costs. corporate aircraft of $49,182, personal use of a company car and driver, and home security-related costs.
A. McEvoy. $0.
EXECUTIVE PERQUISITES & OTHER BENEFITSWe value perquisites and other personal benefits based on the incremental cost to the Company.
Our named executive officers participate inWe calculate the same employee benefits provided to all other non-union U.S. employees. In addition, they participate in the following benefits and perquisites:
Executive Life Insurance: Effective January 2015, we closed this program to new participants. We grandfathered prior participants. Messrs. Gorsky, Caruso, and Stoffels participated in the program in 2017.
Personal Useincremental cost for personal use of Company Aircraftaircraft as the sum of the cost of trip-related crew hotels and Cars: Our named executive officers can use companymeals, in-flight food and beverages, landing and ground handling fees, hangar or aircraft parking costs, fuel costs based on the average annual cost of fuel per mile flown and other smaller variable costs. Fixed costs such as aircraft purchase costs, maintenance not related to personal trips and flight crew salaries are not included.
We calculate the incremental cost for limited personal travel and companyCompany cars and drivers for commutation and other personal transportation. These perquisitestransportation as the sum of the cost of fuel, driver overtime fees and other smaller variable costs. Fixed costs such as car purchase costs, maintenance not related to personal trips and driver salaries are intendednot included. Named executive officers are taxed on the imputed income attributable to minimize distractions and ensure the safety and productivity of our executives. Home Security: We reimburse limited home security system related fees.
We detail the executive life insurance premiums paid, values oftheir personal use of companyCompany aircraft and cars and home security related costs in the perquisites and other personal benefits table on page 72. Our named executive officers pay the income taxes due on the value of these benefits and perquisites.
COMPENSATION TARGET SETTING PROCESS AND PAY POSITION
Before each year begins, we set compensation targets to ensure that we can compete for talent and to maintain internal equity among positions with similar responsibilities. We conduct an annual review of publicly available information and executive compensation surveys to determine current pay levels among the Executive Peer Group. The Committee reviews market data to understand how our target pay levels compare to benchmark positions. It does not target total compensation to a specific percentile of the Executive Peer Group.
2017 PAY MIX AT TARGET
Our pay mix at target for our named executive officers is a result of our compensation targets that emphasize long-term versus short-term compensation.
| | | | 2018 Proxy Statement - 60
| | |
Peer Groups for Pay and Performance
We use two peer groups for executive compensation:
Executive Peer Group: We use the Executive Peer Group to assess the competitiveness of the compensation of our named executive officers.
Competitor Composite Peer Group: We use the Competitor Composite Peer Group to evaluate the relative performance of our company.
As described below, the two peer groups vary because executive compensation levels and practices are influenced by business complexity and company size. Most of our business competitors are smaller than Johnson & Johnson or even each of our individual businesses.
EXECUTIVE PEER GROUP
The Committee compares our executive compensation levels and practices to those of the Executive Peer Group companies. It consists of companies that generally: are similar to Johnson & Johnson's size and scope; have executive positions similar to ours; and compete with us for executive talent. The Committee reviews the composition of the Executive Peer Group annually.
We compare our salaries, annual performance bonuses, long-term incentives, and total direct compensation to the Executive Peer Group companies. We also compare our benefits, perquisites and other compensation to the Executive Peer Group.
We do not include non-U.S. companies because comparable compensation data for the named executive officers is not available. We also do not include companies in industries whose compensation programsreceive tax assistance from us with respect to these amounts. These values are not comparable to our programs, such as the financial services or oil and gas industries.
The following table lists the 2017 Executive Peer Group companies, their business characteristics, and Johnson & Johnson’s rankings among these companies. Each company’s figures are for the most recent four fiscal quarters. Market capitalization is as of December 31, 2017. Johnson & Johnson ranks in the top quartile of the peers for revenue and market capitalization.
| | | | | | | | | | | | | | Company (Ticker Symbol) | Revenue ($ Millions) | Net Income ($ Millions) | Market Cap ($ Billions) | Common Industry (Y/N)(1) | Gross Margin (>40%) | Inter-national Sales (> 33%) | Business Complexity(2) | R&D % of Sales (>or = 5%) | | 3M Company (MMM) | $31,657 | $4,858 | $140 | ü | ü | ü | ü | ü | | Abbott Laboratories (ABT) | 27,390 | 477 | 99 | ü | ü | ü | ü | ü | | The Boeing Company (BA) | 93,392 | 8,197 | 176 | | | ü | ü | | | Bristol-Myers Squibb Company (BMY) | 20,776 | 1,007 | 100 | ü | ü | ü | ü | ü | Cisco Systems, Inc. (CSCO)(3) | 48,096 | (1,445) | 189 | | ü | ü | ü | ü | | The Coca-Cola Company (KO) | 35,410 | 1,248 | 195 | ü | ü | ü | | | | Eli Lilly and Company (LLY) | 22,871 | (204) | 93 | ü | ü | ü | ü | ü | | General Electric Company (GE) | 122,092 | (6,222) | 151 | ü | | ü | ü | | | Intel Corporation (INTC) | 62,761 | 9,601 | 216 | | ü | ü | ü | ü | | International Business Machines Corporation (IBM) | 79,139 | 5,753 | 142 | | ü | ü | ü | ü | Medtronic, plc. (MDT)(3) | 29,725 | 2,807 | 109 | ü
| ü
| ü
| ü
| ü
| | Merck & Co., Inc. (MRK) | 40,122 | 2,568 | 153 | ü | ü | ü | ü | ü | Microsoft Corporation (MSFT)(4) | 98,863 | 11,588 | 660 | ü | ü | ü | ü | ü | | PepsiCo, Inc. (PEP) | 63,525 | 4,857 | 171 | ü | ü | ü | | | | Pfizer Inc. (PFE) | 52,546 | 21,308 | 216 | ü | ü | ü | ü | ü | The Procter & Gamble Company (PG)(4) | 65,732 | 10,119 | 233 | ü | ü | ü | ü | | | United Technologies Corporation (UTX) | 59,837 | 4,552 | 102 | | | ü | ü | | | Johnson & Johnson (JNJ) | 76,450 | 1,300 | 375 | ü | ü | ü | ü | ü | | Johnson & Johnson’s Ranking | 5th |
| 12th |
| 2nd |
| | | | | | | Johnson & Johnson’s Percentile Rank | 76 | % | 35 | % | 94 | % | | | | | |
| | (1)
| Common Industry means that the company is in an industry similar to one of Johnson & Johnson’s business segments: pharmaceutical, medical devices or consumer packaged goods. |
| | (2)
| Business Complexity means the company is a complex organization with multiple product lines. |
| | (3)
| Used last four calendar quarters ending January 26, 2018 for Medtronic, plc. and ending January 27, 2018 for Cisco Systems, Inc. |
| | (4)
| Used last four calendar quarters ending December 31, 2017 for The Procter & Gamble Company and Microsoft Corporation. |
| | | | | | 2018 Proxy Statement - 61
|
COMPETITOR COMPOSITE PEER GROUP
The Committee compares overall company performance to the weighted performance of the Competitor Composite Peer Group companies. For example, when we set the sales goals for our businesses, we compare the sales of our individual businesses to the total sales of their industry competitors. For the TSR component of our PSUs, we weight the TSR within the three groups by market capitalization and weight the three groups using our sales mix each year. We include each of the peer companies in only one of the groups for the TSR comparison.
These companies compete with one, or more, of our three businesses. We evaluate the group on an ongoing basis and update it as necessary. We select the companies based on the following criteria and financial metrics:
Product Relevance
Financial Comparison: Sales growth, net income growth and margin, EPS growth, and TSR
Global Presence
The following table lists the 2017 Competitor Composite Peer Group companies by business.
| | | | | | | | Pharmaceuticals | | Medical Devices | | Consumer | | | | | | | | •
Bristol-Myers Squibb Company•
Roche Holding AG (Pharm Rx only)
| | •
Boston Scientific Corporation•
Edwards Lifesciences Corporation•
The Cooper Companies, Inc.•
Roche Holding AG (Diabetes)•
Zimmer Biomet Holdings, Inc. | | •
Bayer AG (Consumer Healthcare)•
Colgate-Palmolive Company•
GlaxoSmithKline plc (Consumer Healthcare)•
Pfizer Inc. (Consumer Healthcare)•
The Procter & Gamble Company•
Reckitt Benckiser Group plc•
Sanofi SA (Consumer Healthcare) |
Effective in 2017, we included the financial performance of Abbott Laboratories as a whole in our Medical Devices composite in order to better reflect the industries in which we compete. Previously, we had only included its vascular and diabetes businesses.
Effective in 2018, C. R. Bard, Inc. has been removed from the Competitor Composite Peer Group, and Becton, Dickinson and Company has been added.
| | | | 2018 Proxy Statement - 62
| | |
Compensation Decision Process
IMPORTANCE OF CREDO VALUES IN ASSESSING PERFORMANCE
Since 1943, the Johnson & Johnson Credo has guided us in fulfilling our responsibilities to our customers, employees, communities, and shareholders. In assessing our named executive officers’ contributions to Johnson & Johnson’s performance, the Committee not only looks to results-oriented measures of performance, but also considers how those results were achieved. It considers whether the decisions and actions leading to the results were consistent with the values embodied in Our Credo and the long-term impact of their decisions. Credo-based behavior is not something that can be precisely measured. Thus, there is no formula for how Credo-based behavior can, or will, impact an executive’s compensation. The Committee and the Chairman/CEO use their judgment and experience to evaluate whether an executive’s actions were aligned with our Credo values.
ASSESSING "THE WHAT" AND "THE HOW"
We evaluate the performance of our named executive officers based on what objectives they have accomplished and how they have accomplished them.
The “What”: We evaluate each of them against financial and strategic goals for the company and for the business or function that they lead.
The “How”: We also consider how they accomplished their goals. This includes whether the executive achieves business results in a manner that is consistent with the values embodied in Our Credo.
During the first quarter:
The Committee reviews the financial and strategic goals for the company and each of the businesses for the current year.
The Chairman/CEO provides his assessment to the Committee of “the what” and “the how” for each of the other named executive officers for the prior year.
The independent members of the Board of Directors evaluate “the what” and “the how” for the Chairman/CEO for the prior year.
ALIGNING COMPENSATION TO "THE WHAT" AND "THE HOW"
An individual employee can earn from 0% to 200% of the applicable target for annual performance bonuses and long-term incentives based on his or her individual performance on both “the what” and “the how”. This broad range allows for meaningful differentiation based on performance.
The Committee determines annual performance bonuses, long-term incentive awards and salary rates on a component-by-component and total direct compensation basis. The Committee also compares the position of actual compensation for the prior year and target compensation for the current year to Executive Peer Group data.
The independent directors (in the case of the Chairman/CEO) and the Committee (in the case of the other named executive officers) use their judgment and experience to determine bonuses, long-term incentives, and salary rates. Performance against goals is the most significant input in determining compensation levels. However, it does not determine them in a formulaic manner. In addition, we do not consider an employee’s previous long-term incentive awards and total equity ownership when making annual long-term incentive awards.
| | | | | | 2018 Proxy Statement - 63
|
Governance of Executive Compensation
The Committee is responsible for the executive compensation program design and decision-making process. It solicits input from the independent members of the Board of Directors, the Chairman/CEO, other members of management, and its independent compensation consultant, to assist it with its responsibilities.
The Committee has retained an independent compensation consultant from Frederic W. Cook & Co., Inc. (FWC) to advise it on executive compensation matters. The Committee has sole authority to negotiate the terms of service, including all fees paid to FWC.
We summarize the roles of each of the key participants in the executive compensation decision-making process in the table below.
| | | | Participant | Role | Compensation & Benefits Committee | l | Acts on behalf of the Board by setting the principles that guide the design of our compensation and benefits programs | l | Sets the executive compensation philosophy and composition of the Executive Peer Group | l | Approves the compensation target levels | l | Sets compensation programs and principles that are designed to link executive pay with company and individual performance | l | Recommends to the Board the Chairman/CEO’s compensation | l | Reviews and approves compensation decisions recommended by the Chairman/CEO for each of the other named executive officers | l | Reviews the eligibility criteria and award guidelines for the corporate-wide compensation and benefits programs in which the named executive officers participate | Independent Members of the Board of Directors | l | Participate in the performance assessment process for the Chairman/CEO | l | Approve the Chairman/CEO’s compensation | Chairman/CEO | l | Reviews and presents to the Committee the performance assessments and compensation recommendations for each of the other named executive officers | Independent Compensation Consultant | l | Attends all Committee meetings, at the request of the Committee | l | Advises the Committee on market trends, regulatory issues and developments and how they may impact our executive compensation programs | l | Reviews the compensation strategy and executive compensation programs for alignment with our strategic business objectives | l | Advises on the design of executive compensation programs to ensure the linkage between pay and performance | l | Provides market data analyses to the Committee | l | Advises the Committee on setting the Chairman/CEO’s pay | l | Reviews the annual compensation of the other named executive officers as recommended by the Chairman/CEO |
| | | | 2018 Proxy Statement - 64
| | |
INDEPENDENCE OF COMPENSATION CONSULTANT
The Committee determined that FWC’s service as its independent compensation consultant did not raise any conflict of interest concerns. The Committee considered the following factors, among others, when assessing the independence of its compensation consultant:
FWC does not provide any other services to the company and reports directly to the Committee.
FWC has in place policies and procedures to prevent conflicts of interest.
No member of the FWC consulting team serving the Committee has a business or personal relationship with any member of the Committee or any executive officer of the company.
Neither FWC nor any principal of FWC owns any shares of our common stock.
The amount of fees paid to FWC is less than 1% of FWC's total consulting income.
| | | | | | 2018 Proxy Statement - 65
|
Additional Information Concerning Executive Compensation
USE OF TALLY SHEETS
The Committee reviews tally sheets, prepared by management and reviewed by the Committee’s independent compensation consultant for each of our named executive officers. These tally sheets include all the company’s obligations for compensation and benefits under hypothetical termination scenarios. The Committee does not use the tally sheets to determine the various elements of compensation or the actual amounts of compensation to be approved, but instead uses the tally sheets to evaluate the company’s obligations under the plans.
LIMITED EMPLOYMENT ARRANGEMENTS AND AGREEMENTS
Our Severance Pay Plan provides benefits to certain full-time U.S. employees who are involuntarily terminated. We provide two weeks base salary for each year of service, with guaranteed minimums based on an employee’s level. The minimum for our named executive officers is 52 weeks of base salary. We pay severance according to our normal payroll cycle. We do not pay severance as a lump-sum payment.
We provide Dr. Stoffels an annual stipend of $320,000 to assist him in the payment of foreign taxes. While serving as a member of the Executive Committee, he is considered a U.S. employee even though he is a non-resident of the United States. As a result, he is subject to both U.S. taxation and foreign taxation. He does not receive any other tax equalization assistance. The Committee reviews the stipend annually and can terminate it at any time. We do not have employment arrangements or agreements with any of our other named executive officers.
STOCK OWNERSHIP GUIDELINES FOR NAMED EXECUTIVE OFFICERS
We require our named executive officers to own our company’s stock to further align their interests with our shareholders’ interests. They must meet the following requirements: | | | | | Name | Stock Ownership Guideline
as a Multiple of Base Salary
| 2017 Compliance with Stock
Ownership Guidelines?
| Ownership Threshold Met?(1)
| A. Gorsky | 6x | Yes | Yes | D. Caruso | 3x | Yes | Yes | P. Stoffels | 3x | Yes | Yes | S. Peterson | 3x | Yes | Yes | J. Duato | 3x | Yes | Yes | (1)Executive Officers have five years after first becoming subject to the guidelines to achieve the required ownership thresholds.
|
We do not count shares underlying stock options or unearned PSUs as owned shares for these guidelines. A named executive officer cannot sell the after-tax shares received from long-term incentives until his or her ownership threshold is met.
The Nominating & Corporate Governance Committee of the Board monitors compliance with these guidelines on an annual basis. Our hedging policy prohibits named executive officers from transacting in derivative instruments linked to the performance of the company’s securities.
| | | | 2018 Proxy Statement - 66
| | |
EXECUTIVE COMPENSATION RECOUPMENT POLICY
The Board can recoup all or part of any compensation paid to an executive officer in the event of a material restatement of the company’s financial results. The Board will consider:
whether any executive officer received compensation based on the original financial statements because it appeared he or she achieved financial performance targets that in fact were not achieved based on the restatement; and
the accountability of any executive officer whose acts or omissions were responsible, in whole or in part, for the events that led to the restatement and whether such actions or omissions constituted misconduct.
The Board can recoup compensation from senior executives in the event of significant misconduct resulting in a violation of a significant company policy, law, or regulation relating to manufacturing, sales or marketing of products that causes material harm to Johnson & Johnson.
The compensation recoupment policies are available at www.investor.jnj.com/gov/compensation-recoupment-policy.cfm.
TAX IMPACT ON COMPENSATION
We consider objectives such as attracting, retaining and motivating leaders when we design our executive compensation programs. We also consider the tax-deductibility of compensation, but it is not our sole consideration. Due to changes in U.S. tax law as a part of the tax reform act, the opportunity to design programs that are fully tax-deductible for our named executive officers has effectively been eliminated. Therefore, we believe that tax-deductibility will have less of an impact on our program design in the future.
For federal income taxes, compensation is an expense that is fully tax-deductible for almost all our employees. Our named executive officers are treated differently. Their pay above $1 million is not tax-deductible.
In 2017 and prior years, all compensation paid to the CFO and any compensation paid to other named executive officers that was considered performance-based compensation was fully tax-deductible. These exceptions are not available beginning in 2018.
All the compensation that we paid to our CFO in 2017 was fully tax-deductible. We believe that all the compensation we paid to our other named executive officers in 2017 was also tax-deductible except for the following:
Salary amounts over $1 million
Compensation that did not qualify for the performance-based compensation exception:
| | ◦ | The value of restricted share units vested in 2017 |
| | ◦ | Dividend equivalents paid on Certificates of Long-Term Compensation (CLCs) and Certificates of Long-Term Performance (CLPs) that were granted after 1992 |
| | ◦ | Certain perquisites and other benefits |
In 2018 and future years, we expect that earnings from stock options and PSUs granted prior to 2018 (and certain other arrangements) will continue to be tax-deductible because they are considered grandfathered under the tax reform legislation. However, we are waiting for additional guidance on the tax reform act and these amounts may not be tax-deductible. We expect that other compensation paid to our named executive officers above $1 million will not be tax-deductible.and consist primarily of driver overtime, fuel costs, landing fees, handling charges, crew expenses and other incidentals.
Tax reimbursements. In 2013, the Committee discontinued all non-relocation related tax reimbursements for executive officers. Dr. Reed was provided $34,363 in tax assistance related to his relocation as part of our standard executive relocation package. | |
2017 COMPENSATION DECISIONS FOR 2016 PERFORMANCE
The following compensation figures included in this year’s Summary Compensation Table were granted to the named executive officers in February 2017 for performance in 2016:
2017 PSU and RSU awards included in the “Stock Awards” column
The 2017 option award included in the “Option Awards” column
The decisions regarding these awards were discussed in detail in our 2017 | | | | | | 2024 Proxy Statement dated March 15, 2017. For a full understanding of these decisions, please refer to the sections of our 2017 | 97 |
2023 Grants of plan-based awards In the table below, we show the potential ranges of the 2023 annual incentives and the PSUs, RSUs and options granted in 2023. We also include the accounting expense for the 2021-2023, 2022-2024 and 2023-2025 PSUs that were considered modified for accounting purposes because the Consumer Health peers were removed from the TSR calculations following the final separation of our Consumer Health business in August 2023. No additional PSUs were granted as a result of the modification. We include the grant date fair values of the stock awards and option awards in columns E and F of the summary compensation table on page 92. For a complete understanding of the table, please read the descriptions of each column that follow the table. | | | | | | | | | | | | | | | | | | | | | | | | | | | | | | | | | | | | | | | | | | | | | | A | B | C | D | E | F | | G | H | I | J | K | L | M | N | | Name | Award | Grant date | Estimated future payouts under non-equity incentive plan awards (annual incentive) | | Estimated future payouts under equity incentive plan awards (performance share units) | All other stock awards: number of shares of stock or units (#) | All other option awards: number of securities underlying options (#) | Exercise or base price of option awards ($/sh) | Closing market price on the grant date ($) | Grant date fair value of stock and option awards ($) | Threshold ($) | Target ($) | Maximum ($) | | Threshold (#) | Target (#) | Maximum (#) | | J. Duato | Annual Incentive | | $0 | $2,800,000 | $5,600,000 | | | | | | | | | | | 2023-2025 PSU | 2/13/2023 | | | | | 0 | 64,308 | 128,616 | | | | | $9,335,592 | | RSU | 2/13/2023 | | | | | | | | 10,409 | | | | 1,599,051 | | 2021-2023 PSU Modification | 8/18/2023 | | | | | | | | 15,676 | | | | 62,075 | | 2022-2024 PSU Modification | 8/18/2023 | | | | | | | | 15,159 | | | | 69,877 | | 2023-2025 PSU Modification | 8/18/2023 | | | | | | | | 32,154 | | | | 115,548 | | Stock Awards Total | | | | | | | | | | | | 11,182,143 | | Option | 2/13/2023 | | | | | | | | | 172,250 | 162.75 | 162.75 | 4,796,990 | | | J. Wolk | Annual Incentive | | 0 | 1,462,500 | 2,925,000 | | | | | | | | | | | 2023-2025 PSU | 2/13/2023 | | | | | 0 | 32,978 | 65,956 | | | | | 4,787,416 | | RSU | 2/13/2023 | | | | | | | | 5,338 | | | | 820,034 | | 2021-2023 PSU Modification | 8/18/2023 | | | | | | | | 11,060 | | | | 43,796 | | 2022-2024 PSU Modification | 8/18/2023 | | | | | | | | 12,041 | | | | 55,504 | | 2023-2025 PSU Modification | 8/18/2023 | | | | | | | | 16,489 | | | | 59,255 | | Stock Awards Total | | | | | | | | | | | | 5,766,005 | | Option | 2/13/2023 | | | | | | | | | 88,334 | 162.75 | 162.75 | 2,460,014 | | J. Reed | Annual Incentive | | $0 | $1,322,500 | $2,645,000 | | | | | | | | | | | RSU | 5/1/2023 | | | | | | | | 75,765 | | | | 11,699,934 | | Stock Awards Total | | | | | | | | | | | | 11,699,934 |
| | | | | | | | | | | | | | | | | | | | | | | | | | | | | | | | | | | | | | | | | | | | | | A | B | C | D | E | F | | G | H | I | J | K | L | M | N | | Name | Award | Grant date | Estimated future payouts under non-equity incentive plan awards (annual incentive) | | Estimated future payouts under equity incentive plan awards (performance share units) | All other stock awards: number of shares of stock or units (#) | All other option awards: number of securities underlying options (#) | Exercise or base price of option awards ($/sh) | Closing market price on the grant date ($) | Grant date fair value of stock and option awards ($) | Threshold ($) | Target ($) | Maximum ($) | | Threshold (#) | Target (#) | Maximum (#) | | J. Taubert | Annual Incentive | | 0 | 1,322,500 | 2,645,000 | | | | | | | | | | | 2023-2025 PSU | 2/13/2023 | | | | | 0 | 24,130 | 48,260 | | | | | 3,502,952 | | RSU | 2/13/2023 | | | | | | | | 3,906 | | | | 600,048 | | 2021-2023 PSU Modification | 8/18/2023 | | | | | | | | 11,217 | | | | 44,417 | | 2022-2024 PSU Modification | 8/18/2023 | | | | | | | | 12,158 | | | | 56,046 | | 2023-2025 PSU Modification | 8/18/2023 | | | | | | | | 12,065 | | | | 43,357 | | Stock Awards Total | | | | | | | | | | | | 4,246,820 | | Option | 2/13/2023 | | | | | | | | | 64,634 | 162.75 | 162.75 | 1,799,992 | | P. Fasolo | Annual Incentive | | 0 | 890,000 | 1,780,000 | | | | | | | | | | | 2023-2025 PSU | 2/13/2023 | | | | | 0 | 17,133 | 34,266 | | | | | 2,487,198 | | RSU | 2/13/2023 | | | | | | | | 2,773 | | | | 425,994 | | 2021-2023 PSU Modification | 8/18/2023 | | | | | | | | 6,404 | | | | 25,360 | | 2022-2024 PSU Modification | 8/18/2023 | | | | | | | | 6,570 | | | | 30,284 | | 2023-2025 PSU Modification | 8/18/2023 | | | | | | | | 8,567 | | | | 30,784 | | Stock Awards Total | | | | | | | | | | | | 2,999,620 | | Option | 2/13/2023 | | | | | | | | | 45,890 | 162.75 | 162.75 | 1,277,991 | | A. McEvoy | Annual Incentive | | 0 | 1,230,500 | 2,461,000 | | | | | | | | | | | 2023-2025 PSU | 2/13/2023 | | | | | 0 | 22,884 | 45,768 | | | | | 3,322,070 | | RSU | 2/13/2023 | | | | | | | | 3,704 | | | | 569,016 | | 2021-2023 PSU Modification | 8/18/2023 | | | | | | | | 9,410 | | | | 37,262 | | 2022-2024 PSU Modification | 8/18/2023 | | | | | | | | 10,041 | | | | 46,284 | | 2023-2025 PSU Modification | 8/18/2023 | | | | | | | | 11,442 | | | | 41,118 | | Stock Awards Total | | | | | | | | | | | | 4,015,750 | | Option | 2/13/2023 | | | | | | | | | 61,295 | 162.75 | 162.75 | 1,707,004 |
| | | | | | 2024 Proxy Statement entitled “Compensation Discussion and Analysis - CEO Performance and Compensation Decisions” and “Compensation Discussion and Analysis - 2017 Compensation Decisions for 2016 Performance".
| 99 |
| | | | | | 2018 Proxy Statement - 67
|
Executive Compensation Tables
Summary Compensation Table
In the table below, we show the compensation of our Chief Executive Officer, Chief Financial Officer and the three other most highly compensated executive officers for 2017. We also show their compensation for 2016 and 2015 if they were named in the 2017 and 2016 Proxy Statements. For a complete understanding of the table, please read the descriptions of each column that follow the table.
Note on Changes in Pension Values
On page 71 we show the impact of changes in mortality and interest rate assumptions on the 2017 change in pension values included in column G. In 2017, these changes in assumptions added approximately $2.9 million to our Chief Executive Officer’s total compensation. This is 98% of the 2017-2018 year-on-year difference in his total compensation.
| | | | | | | | | | | | | | | | | | A | B | C | D | E | F | G | H | I | Name and Principal Position | Year | Salary ($) | Stock Awards ($) | Option Awards ($) | Non-Equity Incentive Plan Compensation ($) | Change in Pension Value and Non- Qualified Deferred Compensation Earnings ($) | All Other Compensation ($) | Total ($) | | Alex Gorsky | 2017 | $1,600,000 | $12,354,361 | $5,054,398 | $3,598,382 | $6,959,144 | $236,279 | $29,802,564 | | Chairman, CEO | 2016 | 1,600,000 |
| 10,608,901 |
| 4,118,398 |
| 4,652,556 |
| 5,663,771 |
| 228,094 |
| 26,871,720 |
| | | 2015 | 1,613,462 |
| 10,693,427 |
| 4,562,998 |
| 4,009,536 |
| 2,714,268 |
| 202,175 |
| 23,795,866 |
| | Dominic Caruso | 2017 | 932,600 |
| 4,263,779 |
| 1,756,706 |
| 2,156,680 |
| 2,467,265 |
| 159,172 |
| 11,736,202 |
| | EVP, CFO | 2016 | 909,500 |
| 3,624,523 |
| 1,425,643 |
| 2,758,967 |
| 2,475,956 |
| 110,240 |
| 11,304,829 |
| | 2015 | 922,577 |
| 3,497,099 |
| 1,458,603 |
| 2,772,796 |
| 925,536 |
| 112,789 |
| 9,689,400 |
| | Sandra Peterson | 2017 | 1,057,500 |
| 12,027,780 |
| 1,859,996 |
| 1,270,000 |
| 832,000 |
| 128,780 |
| 17,176,056 |
| | EVP, Group Worldwide Chairman | 2016 | 963,462 |
| 3,897,074 |
| 1,539,002 |
| 1,600,000 |
| 592,000 |
| 141,246 |
| 8,732,784 |
| | 2015 | 908,654 |
| 3,504,177 |
| 1,574,621 |
| 1,125,000 |
| 367,000 |
| 147,000 |
| 7,626,452 |
| | Joaquin Duato | 2017 | 897,254 |
| 11,483,016 |
| 1,650,003 |
| 1,928,262 |
| 3,329,047 |
| 71,726 |
| 19,359,308 |
| | EVP, Worldwide Chairman Pharmaceuticals | 2016 | 875,000 |
| 3,198,483 |
| 1,260,002 |
| 2,158,006 |
| 2,535,760 |
| 77,278 |
| 10,104,529 |
| | | | | | | | | | | Paulus Stoffels | 2017 | 1,173,023 |
| 4,630,306 |
| 1,859,996 |
| 2,139,188 |
| 3,335,134 |
| 443,139 |
| 13,580,786 |
| | EVP, CSO | 2016 | 1,144,000 |
| 4,383,454 |
| 1,750,317 |
| 2,425,461 |
| 2,642,012 |
| 380,232 |
| 12,725,476 |
| | | 2015 | 1,158,385 |
| 4,208,874 |
| 1,823,246 |
| 2,172,098 |
| 1,022,024 |
| 401,118 |
| 10,785,745 |
|
Salary (Column C)
Column C includes the base salaries paid for the year.
U.S. salaried employees are paid on a bi-weekly schedule. In 2015, there were 27 pay periods rather than the usual 26 pay periods. So, salaries earned in 2015 were higher than each executive’s annualized base salary due to the additional pay period.
Stock Awards (Column D)
Column D includes the grant date fair value of Performance Share Unit (PSU) and Restricted Share Unit (RSU) awards. See “Grants of Plan-Based Awards” on page 73 for details on 2017.
PSUs are considered granted when the performance goals are approved (according to US accounting rules). Since we use 3, 1-year sales goals, 7/9ths of the 2017 award and 1/9th of the prior two years' awards are considered granted in 2017 as shown in the following table.
Estimated future payouts under non-equity incentive plan awards (columns D through F)
Columns D through F include the threshold, target and maximum annual incentive amounts for 2023 performance. The Board and the Committee considered this potential range when they determined the actual annual incentives included in column G of the summary compensation table on page 92. Estimated future payouts under equity incentive plan awards (columns G through I) Columns G through I include the threshold, target and maximum number of PSUs that were granted in 2023 based on 2022 performance. All other stock awards (column J) Column J includes the number of RSUs awarded in February 2023 based on 2022 performance. Column J also includes the number of 2021-2023, 2022-2024 and 2023-2025 PSUs that were considered modified for accounting purposes because the Consumer Health peers were removed from the TSR calculations following the final separation of our Consumer Health business in August 2023. No additional PSUs were granted as a result of the modification. See "Impact of significant one-time events on the open PSU performance periods" on page 70 for additional details. For Dr. Reed, column J includes the number of RSUs granted to him in May 2023 following his hire. This award replaced the $6.2 million of forfeited equity incentives from his prior employer that would have vested more than 12 months after his hire date and $5.5 million of annual target 2023 Johnson & Johnson equity incentives (that would have been granted in February). The award vests ratably over a three-year period and is not eligible for continued vesting after a qualifying separation. All other option awards (columns K through M) Columns K through M include the number of options awarded in February 2023 based on 2022 performance, their exercise price and the closing stock price on the date of grant. The exercise price equals the closing price on the NYSE on the grant date. Grant date fair value of stock and option awards (column N) Column N includes the grant date fair values of PSUs, RSUs and option awards granted in 2023. Column N also includes the incremental compensation expense for the 2021-2023, 2022-2024 and 2023-2025 PSUs that were considered modified for accounting purposes because the Consumer Health peers were removed from the TSR calculations following the final separation of our Consumer Health business in August 2023. No additional PSUs were granted as a result of the modification. See "Impact of significant one-time events on the open PSU performance periods" on page 70 for additional details. We include the grant date fair values of the stock awards and option awards in columns D and E of the summary compensation table on page 92.
| | | | 2018 Proxy Statement - 68
| | |
| | | | | | | 100 |
| | | | | | PSU Award | Fraction of Award Considered Granted in 2017 | 2017 Operational Sales | 2017-2019 Cumulative Adjusted Operational EPS | 2017-2019 Relative TSR | Total | 2017-2019 | 1/9th
| 3/9th
| 3/9th
| 7/9th
| 2016-2018 | 1/9th
| N.A. | N.A. | 1/9th
| 2015-2017 | 1/9th
| N.A. | N.A. | 1/9th
|
The following table details the number and value of the PSUs assuming achievement at (i) threshold, (ii) target and (iii) maximum performance (at 200%). | | | | | | | | | | | | | Name | Award | Performance Share Units | | Units | Grant Date Fair Value | Threshold (#) | Target (#) | Maximum (#) | Threshold ($) | Target ($) | Maximum ($) | | A. Gorsky | 2017-2019 PSU | 0 |
| 61,792 |
| 123,584 |
| $0 | $7,052,445 | $14,104,889 | | | 2016-2018 PSU | 0 |
| 8,216 |
| 16,432 |
| 0 | 896,793 | 1,793,586 | | | 2015-2017 PSU | 0 |
| 9,213 |
| 18,426 |
| 0 | 1,035,532 | 2,071,064 | | D. Caruso | 2017-2019 PSU | 0 |
| 21,477 |
| 42,954 |
| 0 | 2,451,213 | 4,902,426 | | | 2016-2018 PSU | 0 |
| 2,844 |
| 5,688 |
| 0 | 310,428 | 620,857 | | | 2015-2017 PSU | 0 |
| 2,945 |
| 5,890 |
| 0 | 331,015 | 662,030 | | S. Peterson | 2017-2019 PSU | 0 |
| 22,740 |
| 45,480 |
| 0 | 2,595,362 | 5,190,723 | | | 2016-2018 PSU | 0 |
| 3,070 |
| 6,140 |
| 0 | 335,097 | 670,193 | | | 2015-2017 PSU | 0 |
| 3,179 |
| 6,358 |
| 0 | 357,316 | 714,633 | | J. Duato | 2017-2019 PSU | 0 |
| 20,172 |
| 40,344 |
| 0 | 2,302,271 | 4,604,541 | | | 2016-2018 PSU | 0 |
| 2,514 |
| 5,028 |
| 0 | 274,408 | 548,816 | | | 2015-2017 PSU | 0 |
| 2,726 |
| 5,452 |
| 0 | 306,400 | 612,799 | | P. Stoffels | 2017-2019 PSU | 0 |
| 22,740 |
| 45,480 |
| 0 | 2,595,362 | 5,190,723 | | | 2016-2018 PSU | 0 |
| 3,492 |
| 6,984 |
| 0 | 381,159 | 762,318 | | | 2015-2017 PSU | 0 |
| 3,681 |
| 7,362 |
| 0 | 413,741 | 827,481 |
Option Awards (Column E)
Column E includes the grant date fair value of stock option awards. See “Grants of Plan-Based Awards” on page 73 for details on 2017.
Non-Equity Incentive Plan Compensation (Column F)
Column F includes the annual performance bonus, Certificates of Long-Term Performance (CLPs) that vested, and dividend equivalents received on vested Certificates of Long-Term Compensation (CLCs) and CLPs.
Annual Performance Bonuses: The Board and Committee approved the annual performance bonuses after reviewing performance for the year. We determine the size of the bonuses and pay them out in the first quarter of the year after the performance year.
CLCs and CLPs: We stopped granting CLCs and CLPs in 2012. These cash-based long-term incentives have all vested and will be paid out in accordance with their original terms. The values of CLCs and CLPs are included in several tables in this Proxy Statement. The:
| | ◦ | Non-Equity Incentive Plan Compensation column includes the value when they vested and the dividend equivalents paid on vested CLCs and CLPs. |
| | | | | | | | | | | | | | | | | | | | | | | | | Details on 2023 long-term incentive grant date fair values per unit or option | | | | | | | | | | | We used the same grant date, common stock fair market value and dividend yield assumptions to calculate the fair values of the PSUs, options and RSUs for the February 13, 2023 annual grant. We used the same methodology to calculate the fair value of the May 1, 2023 RSU grant to Dr. Reed. We calculated the fair value of RSUs and the PSUs tied to 2023-2025 EPS based on the common stock fair market value discounted by the expected dividend yield since dividends are not paid prior to vesting. We calculated the fair value of the 2023-2025 PSUs using the weighted average of the fair values of the EPS and relative TSR components. An independent third party calculated the fair value of the PSUs tied to relative TSR using a Monte Carlo simulation. We valued the options using the Black-Scholes model with the assumptions below. | | | | | | | | | Assumptions used in PSU, RSU and option fair value calculations | | | Grant date | | 2/13/2023 | 5/1/2023 | | | Common stock fair market value (closing price on the NYSE) | | $162.75 | $163.60 | | | Dividend yield | | 2.90 | % | 2.90 | % | | | | | | | | | | Weight | Fair value | Fair value | | | 2023 RSU fair values | | $153.622 | $154.424 | | | | | | | | | 2023-2025 PSU fair value | | | 2023-2025 EPS | 50% | $149.189 | N/A | | | 2023-2025 Relative TSR | 50% | $141.150 | N/A | | | Weighted average value per PSU | | $145.170 | N/A | | | | | | | | | 2023 Option fair value | | | | | | Exercise price | | $162.75 | N/A | | | Risk free rate (determined based on the seven-year U.S. treasury rate) | | 3.74 | % | N/A | | | Expected volatility (calculated using blended historical average volatility and implied volatility on at-the-money, two-year, traded options) | | 17.690 | % | N/A | | | Expected life in years (calculated based on historical data) | | 7.00 | N/A | | | Fair value per option | | $27.849 | N/A | | | | | | | |
2023 Outstanding equity awards at fiscal year-end In the table below, we show the outstanding options, RSUs and PSUs as of fiscal year-end 2023. | | | | | | | | | | | | | | | | | | | | | | | | | | | | | | | | | | | | | A | B | C | D | E | F | G | | H | I | J | K | | Name | Grant date | Vesting type | Options | | Stock awards | Number of securities underlying unexercised options (#) | Option exercise price ($) | Option
expiration
date | | Number of shares or units of stock that have not vested (#) | Market value of shares or units of stock that have not vested ($) | Equity incentive plan awards: number of unearned shares, units or other rights that have not vested (#) | Equity incentive plans: market or payout value of unearned shares, units or other rights that have not vested ($) | | Exercisable | Unexercisable | | | J. Duato | Options | | 2/10/2014 | 3-Year Cliff | 130,969 | | $90.44 | 2/9/2024 | | | | | | | 2/9/2015 | 3-Year Cliff | 126,369 | | 100.06 | 2/9/2025 | | | | | | | 2/8/2016 | 3-Year Cliff | 125,824 | | 101.87 | 2/8/2026 | | | | | | | 2/13/2017 | 3-Year Cliff | 123,291 | | 115.67 | 2/13/2027 | | | | | | | 2/12/2018 | 3-Year Cliff | 105,307 | | 129.51 | 2/12/2028 | | | | | | | 2/11/2019 | 3-Year Cliff | 110,868 | | 131.94 | 2/11/2029 | | | | | | | 2/10/2020 | 3-Year Cliff | 133,516 | | 151.41 | 2/10/2030 | | | | | | | 2/8/2021 | 3-Year Cliff | | 114,776 | 164.62 | 2/8/2031 | | | | | | | 2/14/2022 | 3-Year Cliff | | 99,811 | 165.89 | 2/14/2032 | | | | | | | 2/13/2023 | 3-Year Ratable | | 172,250 | 162.75 | 2/13/2033 | | | | | | | RSUs | | 2/8/2021 | 3-Year Cliff | | | | | | 5,225 | $818,967 | | | | 2/14/2022 | 3-Year Cliff | | | | | | 5,053 | 792,007 | | | | 2/13/2023 | 3-Year Ratable | | | | | | 10,409 | 1,631,507 | | | | PSUs | | 2/8/2021 | 3-Year Cliff | | | | | | 36,618 | 5,739,505 | | | | 2/14/2022 | 3-Year Cliff | | | | | | 0 | 0 | 27,300 | $4,279,002 | | 2/13/2023 | 3-Year Cliff | | | | | | 0 | 0 | 38,328 | 6,007,531 | | J. Wolk | Options | | 2/9/2015 | 3-Year Cliff | 13,015 | | 100.06 | 2/9/2025 | | | | | | | 2/8/2016 | 3-Year Cliff | 16,820 | | 101.87 | 2/8/2026 | | | | | | | 2/13/2017 | 3-Year Cliff | 19,241 | | 115.67 | 2/13/2027 | | | | | | | 2/12/2018 | 3-Year Cliff | 12,066 | | 129.51 | 2/12/2028 | | | | | | | 2/11/2019 | 3-Year Cliff | 66,386 | | 131.94 | 2/11/2029 | | | | | | | 2/10/2020 | 3-Year Cliff | 88,219 | | 151.41 | 2/10/2030 | | | | | | | 2/8/2021 | 3-Year Cliff | | 80,976 | 164.62 | 2/8/2031 | | | | | | | 2/14/2022 | 3-Year Cliff | | 79,280 | 165.89 | 2/14/2032 | | | | | | | 2/13/2023 | 3-Year Ratable | | 88,334 | 162.75 | 2/13/2033 | | | | | | | RSUs | | 2/8/2021 | 3-Year Cliff | | | | | | 3,686 | 577,744 | | | | 2/14/2022 | 3-Year Cliff | | | | | | 4,014 | 629,154 | | | | 2/13/2023 | 3-Year Ratable | | | | | | 5,338 | 836,678 | | | | PSUs | | 2/8/2021 | 3-Year Cliff | | | | | | 25,835 | 4,049,378 | | | | 2/14/2022 | 3-Year Cliff | | | | | | 0 | 0 | 21,685 | 3,398,907 | | 2/13/2023 | 3-Year Cliff | | | | | | 0 | 0 | 19,655 | 3,080,725 | | J. Reed | RSUs | | | 5/1/2023 | 3-Year Ratable | | | | | | 75,765 | 11,875,406 | | |
Change in Pension Value and Non-Qualified Deferred Compensation Earnings column includes the annual change in value of vested CLCs and CLPs, but only to extent that the unit values grow at a rate that exceeds a reference rate of return. | | ◦ | Non-Qualified Deferred Compensation table on page 81 includes the value of vested CLCs and CLPs that have not been paid out.
|
| | | | | | | | | | | | | | | | | | | | | | | | | | | | | | | | | | | | | | | | | | | A | B | C | D | E | F | G | | H | I | J | K | | Name | Grant date | Vesting type | Options | | Stock awards | Number of securities underlying unexercised options (#) | Option exercise price ($) | Option
expiration
date | | Number of shares or units of stock that have not vested (#) | Market value of shares or units of stock that have not vested ($) | Equity incentive plan awards: number of unearned shares, units or other rights that have not vested (#) | Equity incentive plans: market or payout value of unearned shares, units or other rights that have not vested ($) | | Exercisable | Unexercisable | | | J. Taubert | Options | | | | | | | | | | | | 2/10/2014 | 3-Year Cliff | 59,397 | | $90.44 | 2/9/2024 | | | | | | | 2/9/2015 | 3-Year Cliff | 58,504 | | 100.06 | 2/9/2025 | | | | | | | 2/8/2016 | 3-Year Cliff | 56,471 | | 101.87 | 2/8/2026 | | | | | | | 2/13/2017 | 3-Year Cliff | 43,712 | | 115.67 | 2/13/2027 | | | | | | | 2/12/2018 | 3-Year Cliff | 43,391 | | 129.51 | 2/12/2028 | | | | | | | 2/11/2019 | 3-Year Cliff | 67,397 | | 131.94 | 2/11/2029 | | | | | | | 2/10/2020 | 3-Year Cliff | 91,324 | | 151.41 | 2/10/2030 | | | | | | | 2/8/2021 | 3-Year Cliff | | 82,127 | 164.62 | 2/8/2031 | | | | | | | 2/14/2022 | 3-Year Cliff | | 80,055 | 165.89 | 2/14/2032 | | | | | | | 2/13/2023 | 3-Year Ratable | | 64,634 | 162.75 | 2/13/2033 | | | | | | | RSUs | | | 2/8/2021 | 3-Year Cliff | | | | | | 3,739 | $586,051 | | | | 2/14/2022 | 3-Year Cliff | | | | | | 4,053 | 635,267 | | | | 2/13/2023 | 3-Year Ratable | | | | | | 3,906 | 612,226 | | | | PSUs | | | 2/8/2021 | 3-Year Cliff | | | | | | 26,202 | 4,106,901 | | | | 2/14/2022 | 3-Year Cliff | | | | | | 0 | 0 | 21,896 | $3,431,979 | | 2/13/2023 | 3-Year Cliff | | | | | | 0 | 0 | 14,381 | 2,254,078 | | P. Fasolo | Options | | | 2/12/2018 | 3-Year Cliff | 41,055 | | 129.51 | 2/12/2028 | | | | | | | 2/11/2019 | 3-Year Cliff | 41,618 | | 131.94 | 2/11/2029 | | | | | | | 2/10/2020 | 3-Year Cliff | 53,151 | | 151.41 | 2/10/2030 | | | | | | | 2/8/2021 | 3-Year Cliff | | 46,888 | 164.62 | 2/8/2031 | | | | | | | 2/14/2022 | 3-Year Cliff | | 43,256 | 165.89 | 2/14/2032 | | | | | | | 2/13/2023 | 3-Year Ratable | | 45,890 | 162.75 | 2/13/2033 | | | | | | | RSUs | | | 2/8/2021 | 3-Year Cliff | | | | | | 2,135 | 334,640 | | | | 2/14/2022 | 3-Year Cliff | | | | | | 2,190 | 343,261 | | | | 2/13/2023 | 3-Year Ratable | | | | | | 2,773 | 434,640 | | | | PSUs | | | 2/8/2021 | 3-Year Cliff | | | | | | 14,959 | 2,344,674 | | | | 2/14/2022 | 3-Year Cliff | | | | | | 0 | 0 | 11,832 | 1,854,548 | | 2/13/2023 | 3-Year Cliff | | | | | | 0 | 0 | 10,211 | 1,600,472 |
2018 Proxy Statement - 69
|
| | | | | | | | | | | | | | | | | | | | | | | | | | | | | | | | | | | | | A | B | C | D | E | F | G | | H | I | J | K | | Name | Grant date | Vesting type | Options | | Stock awards | Number of securities underlying unexercised options (#) | Option exercise price ($) | Option
expiration
date | | Number of shares or units of stock that have not vested (#) | Market value of shares or units of stock that have not vested ($) | Equity incentive plan awards: number of unearned shares, units or other rights that have not vested (#) | Equity incentive plans: market or payout value of unearned shares, units or other rights that have not vested ($) | | Exercisable | Unexercisable | | | | | | | | | | | | | | | A. McEvoy | Options | | | 2/10/2014 | 3-Year Cliff | 49,225 | | $90.44 | 2/9/2024 | | | | | | | 2/9/2015 | 3-Year Cliff | 46,803 | | 100.06 | 2/9/2025 | | | | | | | 2/8/2016 | 3-Year Cliff | 43,689 | | 101.87 | 2/8/2026 | | | | | | | 2/13/2017 | 3-Year Cliff | 37,361 | | 115.67 | 2/13/2027 | | | | | | | 2/12/2018 | 3-Year Cliff | 41,889 | | 129.51 | 2/12/2028 | | | | | | | 2/11/2019 | 3-Year Cliff | 58,972 | | 131.94 | 2/11/2029 | | | | | | | 2/10/2020 | 3-Year Cliff | 76,712 | | 151.41 | 2/10/2030 | | | | | | | 2/8/2021 | 3-Year Cliff | | 68,894 | 164.62 | 2/8/2031 | | | | | | | 2/14/2022 | 3-Year Cliff | | 66,110 | 165.89 | 2/14/2032 | | | | | | | 2/13/2023 | 3-Year Ratable | | 61,295 | 162.75 | 2/13/2033 | | | | | | | RSUs | | | 2/8/2021 | 3-Year Cliff | | | | | | 3,136 | $491,537 | | | | 2/14/2022 | 3-Year Cliff | | | | | | 3,347 | 524,609 | | | | 2/13/2023 | 3-Year Ratable | | | | | | 3,704 | 580,565 | | | | PSUs | | | 2/8/2021 | 3-Year Cliff | | | | | | 21,980 | 3,445,145 | | | | 2/14/2022 | 3-Year Cliff | | | | | | 0 | 0 | 18,083 | $2,834,329 | | 2/13/2023 | 3-Year Cliff | | | | | | 0 | 0 | 13,639 | 2,137,777 |
Vesting type (column C) •3-Year Ratable. Beginning with the February 13, 2023 grant, options and RSUs vest one-third per year on each of the first, second and third anniversaries of the grant date. •3-Year Cliff. Options and RSUs granted before February 13, 2023, and PSUs vest 100% three-years from the date of grant. PSUs are not distributed until the percent of target vested based on performance is certified by the Committee at the end of the three-year performance period. Number of shares or units of stock that have not vested (column H). The PSUs that have been earned based on performance to date are included in column H. See 2021-2023 Performance share unit payout on page 70 for details. Equity incentive plan awards: number of unearned shares, units or other rights that have not vested (column J). We calculated the estimated number of PSUs to vest in the future assuming: •2022-2024 PSUs tied to Relative TSR performance vest at 71.2% of target and cumulative adjusted EPS performance vest at 108.9% of target. •2023-2025 PSUs tied to Relative TSR performance vest at 0.0% of target and cumulative adjusted EPS performance vest at 119.2% of target. Market value of shares or units of stock that have not vested (columns I and K). We calculated the market values of unvested RSUs and PSUs included in columns I and K using the closing price of our common stock on the NYSE on December 29, 2023, which was the last business day of fiscal 2023, of $156.74. The following table details the amounts included in column F. | | | | | | | | | | | | | | Non-Equity Incentive Plan Compensation | | Name | Year | Annual Performance Bonus ($) | Value of CLP Units that Vested in Fiscal Year ($) | Value of CLC Dividend Equivalents Earned During the Fiscal Year ($) | Value of CLP Dividend Equivalents Earned During the Fiscal Year ($) | Total ($) | | A. Gorsky | 2017 | $3,080,000 | $0 | $398,400 | $119,982 | $3,598,382 | | | 2016 | 3,780,000 |
| 378,529 |
| 378,000 |
| 116,027 |
| 4,652,556 |
| | | 2015 | 2,800,000 |
| 761,427 |
| 354,000 |
| 94,109 |
| 4,009,536 |
| | D. Caruso | 2017 | 1,230,000 |
| 0 |
| 796,800 |
| 129,880 |
| 2,156,680 |
| | | 2016 | 1,534,800 |
| 342,568 |
| 756,000 |
| 125,599 |
| 2,758,967 |
| | | 2015 | 1,136,900 |
| 824,240 |
| 708,000 |
| 103,656 |
| 2,772,796 |
| | S. Peterson | 2017 | 1,270,000 |
| 0 |
| 0 |
| 0 |
| 1,270,000 |
| | | 2016 | 1,600,000 |
| 0 |
| 0 |
| 0 |
| 1,600,000 |
| | | 2015 | 1,125,000 |
| 0 |
| 0 |
| 0 |
| 1,125,000 |
| | J. Duato | 2017 | 1,350,000 |
| 0 |
| 514,600 |
| 63,662 |
| 1,928,262 |
| | | 2016 | 1,400,000 |
| 208,193 |
| 488,250 |
| 61,563 |
| 2,158,006 |
| | | | | | | | | | P. Stoffels | 2017 | 1,530,000 |
| 0 |
| 531,200 |
| 77,988 |
| 2,139,188 |
| | | 2016 | 1,600,000 |
| 246,044 |
| 504,000 |
| 75,417 |
| 2,425,461 |
| | | 2015 | 1,144,000 |
| 494,927 |
| 472,000 |
| 61,171 |
| 2,172,098 |
|
| | | | | | | 104 | Change in Pension Value and Non-Qualified Deferred Compensation Earnings (Column G)
Column G includes the increase in the present value of the accrued pension benefit and the above-reference-rate non-qualified deferred compensation earnings.
Change in Pension Value
The change in pension present value is not a current cash payment. The pensions are only paid after retirement.
Impact of Service, Pay, and Age: The following factors increased the present values:
| | ◦ | Service: An additional year of completed service was included in the calculation of benefits. |
2023 Option exercises and stock vested In the table below, we show how many options each executive exercised in 2023 and the value received from exercising them. We also show how many PSUs and RSUs vested in 2023 and their value when they vested. | | | | | | | | | | | | | | | | | | | Name | Option awards | | Stock awards | Number of shares acquired on exercise
(#) | Value realized
upon exercise
($) | | Number of shares acquired on vesting
(#) | Value realized
upon vesting
($) | | J. Duato | 148,538 | $14,985,999 | | 36,539 | $5,920,049 | | J. Wolk | 0 | 0 | | 24,142 | 3,911,487 | | J. Reed | 0 | 0 | | 0 | 0 | | J. Taubert | 0 | 0 | | 24,992 | 4,049,204 | | P. Fasolo | 0 | 0 | | 14,546 | 2,356,743 | | A. McEvoy | 0 | 0 | | 20,993 | 3,401,286 |
2023 Pension benefits In the table below, we show the present value of pension benefits as of year-end 2023 and payments during 2023. For a complete understanding of the table, please read the description of the pension benefits on page 106. | | | | | | | | | | | | | | | | | | | | | | Name | Number of years credited service
(#) | Normal retirement age | Present value of accumulated benefits | Payments during last fiscal year
($) | Salaried pension plan
($) | Excess
pension plan
($) | Total
($) | | J. Duato | 34 | 62 | $1,917,000 | $22,209,000 | $24,126,000 | $0 | | J. Wolk | 25 | 62 | 1,155,000 | 8,782,000 | 9,937,000 | 0 | | J. Reed | 0 | 65 | 33,000 | 341,000 | 374,000 | 0 | | J. Taubert | 18 | 62 | 976,000 | 6,753,000 | 7,729,000 | 0 | | P. Fasolo | 16 | 62 | 868,000 | 4,452,000 | 5,320,000 | 0 | | A. McEvoy | 27 | 62 | 1,019,000 | 5,625,000 | 6,644,000 | 0 |
We calculated the present values in the table using the same assumptions we used for the pension liabilities included in our 2023 Annual Report. We provide pension benefits to our employees to provide retirement income, facilitate succession and motivate long-service. Our pension benefits are paid through our salaried pension plan and excess pension plan as described below. The named executive officers participate in the defined benefit pension plan on the same basis as other U.S. non-union employees. For all NEOs other than Dr. Reed, their pension benefit is determined solely under the formula that applies to other eligible U.S. non-union employees hired before January 1, 2015 (the Final Average Pay formula). We offset the benefits from the final average pay plans for amounts earned from our non-U.S. pension plans. For Dr. Reed, his pension benefit is determined under the formula applicable to employees hired on or after January 1, 2015 (the Retirement Value Plan, or RVP, formula). Starting on January 1, 2026, all eligible U.S. non-union employees (regardless of hire date) will accrue benefits under the defined benefit pension plan formula that applies to employees hired on or after January 1, 2015. •U.S. Final Average Pay pension formula. This formula determines a monthly annuity amount payable for life. •Retirement age. At age 62 former employees can begin receiving unreduced pension payments. At age 55 they can begin receiving reduced pension benefits. If a former employee begins receiving his or her pension before age 62, the pension is reduced by 4% per year for each year before age 62. •Monthly annuity amount. We calculate the monthly annuity amount as: (1)Final average earnings multiplied by 1.667%, multiplied by years of service prior to 2005, plus (2)Final average earnings multiplied by 1.55%, multiplied by years of service after 2004, minus (3)Age 65 Social Security benefits multiplied by 1.429%, multiplied by total years of service, plus (4)Frozen grandfathered benefits related to pre-2009 dividend equivalents on unvested CLCs (less than 2% of the total pension benefit for each named executive officer). •Final average earnings. Final average earnings is the average of the highest consecutive 60 months out of the last 120 months of pay. Earnings include base salary and annual incentive payouts. •Benefits paid as an annuity. Final average pay benefits under the Salaried Pension Plan and Excess Pension Plan must be taken in the form of an annuity. •U.S. Retirement Value Plan pension formula. This formula determines a lump sum payable at the time the employee is deemed to have 'retired' from Johnson & Johnson (generally separation from Johnson & Johnson, or if later, attainment of a specified age). •Retirement age. At age 62 former employees can begin receiving unreduced pension payments. At age 55 they can begin receiving reduced pension benefits. If a former employee begins receiving his or her pension before age 62, the pension is reduced for each year before age 62. •Lump sum amount. Johnson & Johnson calculates the lump sum amount as an RVP credit of 15% of plan earnings for each year of service. The sum of each year’s RVP credits equals the pension benefit payable as a lump sum at age 62. •Plan earnings. Earnings include base salary and annual incentive payouts. •Form of benefit payment. RVP benefits under the Excess Pension Plan benefit are available only as a lump sum. RVP benefits under the Salaried Pension Plan are expressed as a lump sum but can also be payable in one of the optional annuity forms available for RVP benefits under the Salaried Pension Plan. •Pension plans. We pay our U.S. pensions from the Salaried and Excess Pension Plans as follows: •Salaried Pension Plan. The Salaried Pension Plan applies the Final Average Pay and RVP formulas, as applicable, to pay up to the IRS’s covered compensation limit. The limit was $330,000 in 2023. •Excess Pension Plan. The Excess Pension Plan uses the Final Average Pay and RVP pension formulas, as applicable, without applying the IRS pay limits. The payments are reduced by amounts paid from the Salaried Pension Plan. U.S. non-union employees participate in the Excess Pension Plan if their covered compensation exceeds the IRS limit. Five-Year Average Pay: The five-year average pay increased since the previous fiscal year-end. | | ◦ | Age: Each executive is one year closer to the age when we the assume the pension payments will begin.
|
Impact of Changes in Assumptions: The change in present value is highly sensitive to changes in mortality and interest rate assumptions which can increase or decrease the values. The following table details the changes in actuarial assumptions and their net effect on the change in pension value.
| | | | | | Effect of Change in Actuarial Assumptions on Pension Present Value | | Year | Mortality Table | Discount Rate | Net Effect of Changes on Pension Present Value | | 2017 | RP-2014 White Collar Table, Generational Mortality Projection with Scale MMP-2016 | 3.74% | Increase | | 2016 | RP-2014 Table, Generational Mortality Projection | 4.41% | Increase | | 2015 | RP-2014 Table, Generational Mortality Projection | 4.73% | Decrease | | 2014 | RP-2014 Table, Generational Mortality Projection | 4.28% | N.A. |
See “Pension Benefits” on page 80 for details on the pension. See Note 10 to the Consolidated Financial Statements of the 2017 Form 10-K for details on the discount rate.
| | | | 2018 Proxy Statement - 70
| | |
In the table below, we show the 2017 changes in pension value and the impacts of:
Service, pay and age
Changes in assumptions
| | | | | | Change in Pension Value | | Name | Impact of Service, Pay, and Age ($) | Impact of Changes in Assumptions ($) | Total Change in Pension Value ($) | | A. Gorsky | $3,936,000 | $2,871,000 | $6,807,000 | | D. Caruso | 1,390,000 | 829,000 | 2,219,000 | | S. Peterson | 577,000 | 255,000 | 832,000 | | J. Duato | 1,660,000 | 1,519,000 | 3,179,000 | | P. Stoffels | 1,648,000 | 1,526,000 | 3,174,000 |
Above-Reference-Rate Non-Qualified Deferred Compensation Earnings
The above-reference-rate returns on vested CLCs and CLPs are not paid in the current year. They are deferred.
The change in the values of the CLCs and CLPs depend on our long-term operational performance.
We use 120% of the December applicable federal long-term interest rate (AFR) as the reference rate.
Negative figures are not included in the Summary Compensation Table (according to the SEC’s rules).
The following table details the calculation of the above-reference-rate returns on CLCs and CLPs. See page 82 for "Details on CLC and CLP Unit Values". | | | | | Above-Reference-Rate Return | CLC | CLP | | Beginning of Year Unit Value | $46.55 | $5.25 | | End of Year Unit Value | $48.78 | $5.49 | | Change in Unit Value ($) | $2.23 | $0.24 | | Change in Unit Value (%) | 4.79% | 4.57% | | Reference-Rate | 3.16% | 3.16% | | Above-Reference-Rate Return | 1.63% | 1.41% | | Above reference-rate return included in the Summary Compensation Table | 1.63% | 1.41% |
The table below shows the change in pension values and above-reference-rate amounts for vested CLCs and CLPs included in column G. | | | | | | | | | | | Name | Fiscal Year | Change in Pension Value ($) | Above Reference- Rate Calculation for Vested CLCs ($) | Above Reference- Rate Calculation for Vested CLPs ($) | Total ($) | | A. Gorsky | 2017 | $6,807,000 | $91,082 | $61,062 | $6,959,144 | | | 2016 | 5,012,000 | 354,676 | 297,095 | 5,663,771 | | | 2015 | 2,667,000 |
| 47,268 |
| 0 |
| 2,714,268 | | D. Caruso | 2017 | 2,219,000 |
| 182,165 |
| 66,100 |
| 2,467,265 | | | 2016 | 1,445,000 |
| 709,352 |
| 321,604 |
| 2,475,956 | | | 2015 | 831,000 |
| 94,536 |
| 0 |
| 925,536 | | S. Peterson | 2017 | 832,000 |
| 0 |
| 0 |
| 832,000 | | | 2016 | 592,000 |
| 0 |
| 0 |
| 592,000 | | | 2015 | 367,000 |
| 0 |
| 0 |
| 367,000 | | J. Duato | 2017 | 3,179,000 |
| 117,648 |
| 32,339 |
| 3,329,047 | | | 2016 | 1,920,000 |
| 458,123 |
| 157,637 |
| 2,535,760 | | | | | | | | | P. Stoffels | 2017 | 3,174,000 |
| 121,443 |
| 39,691 |
| 3,335,134 | | | 2016 | 1,976,000 |
| 472,901 |
| 193,111 |
| 2,642,012 | | | 2015 | 959,000 |
| 63,024 |
| 0 |
| 1,022,024 |
| | | | | | 2018 Proxy Statement - 71
|
All Other Compensation (Column H)
Column H includes the value of perquisites and other personal benefits, tax reimbursements, company contributions to our 401(k) and Excess Savings Plans, insurance premiums, and stipends: | | | | | | | | | | | | | | | | Name | Fiscal Year | Perquisite and Other Personal Benefits ($) | Tax Reimbursements ($) | Registrant Contributions to Defined Contribution Plans ($) | Insurance Premiums ($) | Stipend ($) | Total ($) | | A. Gorsky | 2017 | $156,187 | $0 | $72,000 | $8,092 | $0 | $236,279 | | | 2016 | 147,865 | 0 | 72,000 | 8,229 | 0 | 228,094 | | | 2015 | 120,941 |
| 0 |
| 73,904 |
| 7,330 |
| 0 |
| 202,175 |
| | D. Caruso | 2017 | 108,753 |
| 0 |
| 41,967 |
| 8,452 |
| 0 |
| 159,172 |
| | | 2016 | 60,824 |
| 0 |
| 40,927 |
| 8,489 |
| 0 |
| 110,240 |
| | | 2015 | 63,179 |
| 0 |
| 42,281 |
| 7,329 |
| 0 |
| 112,789 |
| | S. Peterson | 2017 | 81,193 |
| 0 |
| 47,587 |
| 0 |
| 0 |
| 128,780 |
| | | 2016 | 97,890 |
| 0 |
| 43,356 |
| 0 |
| 0 |
| 141,246 |
| | | 2015 | 105,375 |
| 0 |
| 41,625 |
| 0 |
| 0 |
| 147,000 |
| | J. Duato | 2017 | 31,350 |
| 0 |
| 40,376 |
| 0 |
| 0 |
| 71,726 |
| | | 2016 | 37,903 |
| 0 |
| 39,375 |
| 0 |
| 0 |
| 77,278 |
| | | | | | | | | | | P. Stoffels | 2017 | 61,542 |
| 0 |
| 52,786 |
| 8,811 |
| 320,000 |
| 443,139 |
| | | 2016 | 0 |
| 0 |
| 51,480 |
| 8,752 |
| 320,000 |
| 380,232 |
| | | 2015 | 20,178 |
| 0 |
| 53,079 |
| 7,861 |
| 320,000 |
| 401,118 |
|
| | | | | | | | Details on All Other Compensation • 2017 Perquisites and Other Personal Benefits Detail
| | | Name | Personal Use of Corporate Aircraft ($) | Value of Car and Driver for Personal Transportation ($) | Home Security Related Costs ($) | Total ($) | | | | A. Gorsky | $95,804 | $60,118 | $265 | $156,187 | | | | D. Caruso | 59,484 | 49,269 | 0 | 108,753 | | | | S. Peterson | 57,386 | 23,807 | 0 | 81,193 | | | | J. Duato | 30,488 | 862 | 0 | 31,350 | | | | P. Stoffels | 61,356 | 186 | 0 | 61,542 | | | | ◦ We value perquisites and other personal benefits based on the incremental cost to the company.◦ We calculate the incremental cost for personal use of company aircraft as the sum of the cost of trip-related crew hotels and meals, in-flight food and beverages, landing and ground handling fees, hangar or aircraft parking costs, fuel costs based on the average annual cost of fuel per mile flown, and other smaller variable costs. Fixed costs such as aircraft purchase costs, maintenance not related to personal trips, and flight crew salaries are not included.◦ We calculate the incremental cost for company cars and drivers for commutation and other personal transportation as the sum of the cost of fuel, driver overtime fees, and other smaller variable costs. Fixed costs such as car purchase costs, maintenance not related to personal trips, and driver salaries are not included.◦ Named executive officers are taxed on the imputed income attributable to their personal use of company aircraft and cars and do not receive tax assistance from us with respect to these amounts.• Tax Reimbursements: In 2013, the Committee discontinued all non-relocation related tax reimbursement for executive officers.• Stipend: We provide Dr. Stoffels an annual stipend of $320,000 to assist him in the payment of foreign taxes. While serving as a member of the Executive Committee, he is considered a U.S. employee even though he is a non-resident of the United States. As a result, he is subject to both U.S. taxation and foreign taxation. He does not receive any other tax equalization assistance.
|
| | | | 2018 Proxy Statement - 72
| | |
Grants of Plan-Based Awards
In the table below, we show the potential ranges of the 2017 annual performance bonus and the PSUs considered granted in 2017. We also show the RSU and options granted in 2017. We include the grant date fair values of the stock awards and option awards in columns D and E of the Summary Compensation Table on page 68.
For a complete understanding of the table, please read the descriptions of each column that follow the table.
| | | | | | | | | | | | | | | | | | | | | | | | | | | A | B | C | D | E | F | G | H | I | J | K | L | M | N | | | | | Estimated Future Payouts Under Non-Equity Incentive Plan Awards (Annual Performance Bonus) | Estimated Future Payouts Under Equity Incentive Plan Awards (Performance Share Units) | All other Stock Awards: Number of Shares of Stock or Units (#) | All Other Option Awards: Number of Securities Underlying Options (#) | Exercise or Base Price of Option Awards ($/sh) | Closing Market Price on the Grant Date ($) | Grant Date Fair Value of Stock and Option Awards ($) | | Name | Award | Grant Date | Threshold ($) | Target ($) | Maximum ($) | Threshold (#) | Target (#) | Maximum (#) | | A. Gorsky | Bonus | | $0 | $2,800,000 | $5,600,000 | | | | | | | | | | | 2017-2019 PSU | 2/13/2017 | | | | 0 |
| 61,792 |
| 123,584 |
| | | | | $7,052,445 | | | 2016-2018 PSU | 2/13/2017 | | | | 0 |
| 8,216 |
| 16,432 |
| | | | | 896,793 |
| | | 2015-2017 PSU | 2/13/2017 | | | | 0 |
| 9,213 |
| 18,426 |
| | | | | 1,035,532 |
| | | RSU | 2/13/2017 | | | | | | | 31,779 |
| | | | 3,369,591 |
| | | Stock Awards Total | | | | | | | | | | | | 12,354,361 |
| | | Option Award | 2/13/2017 | | | | | | | | 377,673 |
| $115.67 | $115.88 | 5,054,398 |
| | D. Caruso | Bonus | | 0 |
| 1,171,000 |
| 2,342,000 |
| | | | | | | | | | | 2017-2019 PSU | 2/13/2017 | | | | 0 |
| 21,477 |
| 42,954 |
| | | | | 2,451,213 |
| | | 2016-2018 PSU | 2/13/2017 | | | | 0 |
| 2,844 |
| 5,688 |
| | | | | 310,428 |
| | | 2015-2017 PSU | 2/13/2017 | | | | 0 |
| 2,945 |
| 5,890 |
| | | | | 331,015 |
| | | RSU | 2/13/2017 | | | | | | | 11,045 |
| | | | 1,171,123 |
| | | Stock Awards Total | | | | | | | | | | | | 4,263,779 |
| | | Option Award | 2/13/2017 | | | | | | | | 131,264 |
| 115.67 |
| 115.88 |
| 1,756,706 |
| | S. Peterson | Bonus | | 0 |
| 1,340,625 |
| 2,681,250 |
| | | | | | | | | | | 2017-2019 PSU | 2/13/2017 | | | | 0 |
| 22,740 |
| 45,480 |
| | | | | 2,595,362 |
| | | 2016-2018 PSU | 2/13/2017 | | | | 0 |
| 3,070 |
| 6,140 |
| | | | | 335,097 |
| | | 2015-2017 PSU | 2/13/2017 | | | | 0 |
| 3,179 |
| 6,358 |
| | | | | 357,316 |
| | | RSU | 2/13/2017 | | | | | | | 82,428 |
| | | | 8,740,005 |
| | | Stock Awards Total | | | | | | | | | | | | 12,027,780 |
| | | Option Award | 2/13/2017 | | | | | | | | 138,982 |
| 115.67 |
| 115.88 |
| 1,859,996 |
| | J. Duato | Bonus | | 0 |
| 901,300 |
| 1,802,600 |
| | | | | | | | | | | 2017-2019 PSU | 2/13/2017 | | | | 0 |
| 20,172 |
| 40,344 |
| | | | | 2,302,271 |
| | | 2016-2018 PSU | 2/13/2017 | | | | 0 |
| 2,514 |
| 5,028 |
| | | | | 274,408 |
| | | 2015-2017 PSU | 2/13/2017 | | | | 0 |
| 2,726 |
| 5,452 |
| | | | | 306,400 |
| | | RSU | 2/13/2017 | | | | | | | 81,107 |
| | | | 8,599,937 |
| | | Stock Awards Total | | | | | | | | | | | | 11,483,016 |
| | | Option Award | 2/13/2017 | | | | | | | | 123,291 |
| 115.67 |
| 115.88 |
| 1,650,003 |
| | P. Stoffels | Bonus | | 0 |
| 1,178,300 |
| 2,356,600 |
| | | | | | | | | | | 2017-2019 PSU | 2/13/2017 | | | | 0 |
| 22,740 |
| 45,480 |
| | | | | 2,595,362 |
| | | 2016-2018 PSU | 2/13/2017 | | | | 0 |
| 3,492 |
| 6,984 |
| | | | | 381,159 |
| | | 2015-2017 PSU | 2/13/2017 | | | | 0 |
| 3,681 |
| 7,362 |
| | | | | 413,741 |
| | | RSU | 2/13/2017 | | | | | | | 11,695 |
| | | | 1,240,044 |
| | | Stock Awards Total | | | | | | | | | | | | 4,630,306 |
| | | Option Award | 2/13/2017 | | | | | | | | 138,982 |
| 115.67 |
| 115.80 |
| 1,859,996 |
|
Estimated Future Payouts Under Non-Equity Incentive Plan Awards (Columns D through F)
Columns D through F include the threshold, target, and maximum annual performance bonus amounts for 2017 performance. The Board and Committee considered this potential range when they determined the actual annual performance bonuses (included in column F of the “Summary Compensation Table” on page 68).
2023 Non-qualified deferred compensation | | | | | | 2018 Proxy Statement - 73
|
Estimated Future Payouts Under Equity Incentive Plan Awards (Columns G through I)
Columns G through I include the threshold, target, and maximum number of PSUs that were considered granted in 2017. See page 68 for detail on the awards that were considered granted according to U.S. accounting rules.
For actual performance results to date, please see “2017 Update on Performance of Performance Share Unit Awards versus Goals” on pages 52 to 54.
All Other Stock Awards (Column J)
Column J includes the number of RSUs awarded in February 2017 based on 2016 performance. In addition, it includes the special retention awards the Committee granted to Ms. Peterson and Mr. Duato of 70,733 RSUs, each with a fair value on the grant date of $7.5 million.
All Other Option Awards (Columns K through M)
Columns K through M include: the number of stock options awarded in February 2017 based on 2016 performance, their exercise price, and the closing stock price on the date of grant.
The exercise price equals the average of the high and low stock prices on the NYSE on the grant date. The closing price on the grant date was $0.21 higher than the exercise price.
Grant Date Fair Value of Stock and Option Awards (Column N)
Column N includes the grant date fair values of PSUs, RSUs, and stock option awards granted in 2017. We include the grant date fair values of the stock awards and option awards in columns D and E of the Summary Compensation Table on page 68.
| | | | 2018 Proxy Statement - 74
| | |
In the table below, we show our named executive officers’ year-end non-tax-qualified compensation deferral plan balances. We also show how much they and the Company contributed to the plans, the earnings on the deferred compensation, and withdrawals and distributions during the year. For a complete understanding of the table, please read the descriptions of the columns that follow the table. | | | | | | | | | Details on 2017 Long-Term Incentive Grant Date Fair Values | | | | | | l | Assumptions used for PSUs, RSUs, and options: We used the same grant date, common stock fair market value and dividend yield assumptions in calculating the fair values of the PSUs, RSUs, and options as shown in the table below.
| | | | | Assumptions used in PSUs, RSUs, and Option Fair Value Calculations | | | | | | Grant Date | 2/13/2017 | | | | | | Common Stock Fair Market Value (average of the high and low prices on the NYSE) | $115.67 | | | | | | Dividend yield | 2.90% | | | | | | | | | | | l | Fair values of RSUs and PSUs tied to 2017 operational sales and 2017-2019 EPS: We calculated the fair value of RSUs and PSUs tied to 2017 operational sales and 2017-2019 EPS based on the common stock fair market value discounted by the expected dividend yield since dividends are not paid prior to vesting. The discount is greater on the awards with more time until vesting since those awards do not receive dividends for a longer period than the awards with less time remaining in the vesting period.
| | | | | l | PSUs: | | | l | 2017-2019 PSUs: We calculated the fair value of the 2017-2019 PSUs using the weighted average of the fair values of each component of the award that was considered granted in 2017 as follows:
| | | | | | | | | | | | | 2017 – 2019 PSU Fair Value | | | | | | Performance Measures | Weight | Fair Value | | | | | | 2017 Operational Sales | 1/9th
| $106.032 | | | | | | 2017-2019 EPS | 3/9ths
| $106.032 | | | | | | 2017-2019 Relative TSR | 3/9ths
| $124.933 | | | | | | Weighted Average | $114.132 | | | | | | | | | | | | | l | 2017 Operational Sales & 2017-2019 EPS: $106.032 was the fair value of the PSUs tied to 2017 operational sales and 2017-2019 EPS.
| | | | l | 2017-2019 Relative TSR: $124.933 was the fair value of the PSUs tied to relative TSR. An independent third party calculated it using a Monte Carlo valuation.
| | | l | 2016-2018 PSUs: $109.152 was the fair value of the PSUs tied to 2017 operational sales.
| | | l | 2015-2017 PSUs: $112.399 was the fair value of the PSUs tied to 2017 operational sales.
| | l | RSUs: $106.032 was the fair value of the RSUs.
| | l | Options: $13.383 was fair value of the options. We calculated the option fair value using the Black-Scholes option valuation model using the additional assumptions in the table below.
| | | | | 2017 Stock Option Fair Value Assumptions | | | | | | Exercise Price | $115.67 | | | | | | Risk Free Rate (Determined based on U.S. Treasury rate of seven years) | 2.25% | | | | | | Expected Volatility (Calculated using blended historical average volatility and implied volatility on at-the-money, 2-year, traded stock options) | 15.30% | | | | | | Expected Life (Calculated based on historical data) | 7 yrs. | | | | | | | |
| | | | | | | | | | | | | | | | | | | A | B | C | D | E | F | | Name | Executive
contributions
in last FY
($) | Registrant
contributions
in last FY
($) | Aggregate
earnings
in last FY
($) | Aggregate
withdrawals/
distributions
($) | Aggregate
balance
at last FYE
($) | | J. Duato | $0 | $56,458 | $231,644 | $0 | $9,094,001 | | J. Wolk | 332,038 | 36,808 | 57,054 | 0 | 814,743 | | J. Reed | 0 | 22,967 | 1,512 | 0 | 24,479 | | J. Taubert | 1,450,406 | 36,000 | 1,317,239 | 0 | 9,540,559 | | P. Fasolo | 0 | 24,646 | 46,061 | 0 | 356,460 | | A. McEvoy | 0 | 32,815 | 102,684 | 0 | 2,866,551 |
| | | | | | 2018 Proxy Statement - 75
|
Outstanding Equity Awards at Fiscal Year-End
In the table below, we show the outstanding stock options, RSUs, and PSUs as of fiscal year-end 2017. We also show the values of the RSUs and PSUs. | | | | | | | | | | | | | | | | | | | | A | B | C | D | E | F | G | H | I | J | K | | | | | Options | Stock Awards | Number of Securities Underlying Unexercised Options (#) | Option Exercise Price ($) | Option Expiration Date | Number of Shares or Units of Stock that Have Not Vested (#) | Market Value of Shares or Units of Stock that Have Not Vested ($) | Equity Incentive Plan Awards: Number of Unearned Shares, Units, or Other Rights That Have Not Vested (#) | Equity Incentive Plans: Market or Payout Value of Unearned Shares, Units or Other Rights That Have Not Vested ($) | | Name | Grant Date | Vesting Date | Exercisable | Unexercisable | | A. Gorsky | Stock Options | | 2/08/2010 | 2/09/2013 | 119,770 |
| | $62.62 | 2/07/2020 | | | | | | 1/10/2011 | 1/11/2014 | 144,695 |
| 62.20 |
| 1/08/2021 | | 1/17/2012 | 1/18/2015 | 231,951 |
| 65.37 |
| 1/17/2022 | | 1/16/2013 | 1/17/2016 | 547,692 |
| 72.54 |
| 1/13/2023 | | 2/10/2014 | 2/11/2017 | 495,146 |
| 90.44 |
| 2/09/2024 | | 2/09/2015 | 2/10/2018 | | 427,127 |
| 100.06 |
| 2/09/2025 | | 2/08/2016 | 2/08/2019 | 411,264 |
| 101.87 |
| 2/08/2026 | | 2/13/2017 | 2/13/2020 | 377,673 |
| 115.67 |
| 2/13/2027 | | RSUs | | 2/09/2015 | 2/09/2018 | | | | | 33,165 |
| $4,633,814 | | | | 2/08/2016 | 2/08/2019 | 29,579 |
| 4,132,778 |
| | 2/13/2017 | 2/13/2020 | 31,779 |
| 4,440,162 |
| | 2015-2017 PSU Award | | 2/09/2015 | 2/09/2018 | | | | | 93,120 |
| 13,010,726 |
| | | | 2/08/2016 | 2/09/2018 | 10,890 |
| 1,521,551 |
| | 2/13/2017 | 2/09/2018 | 8,752 |
| 1,222,829 |
| | 2016-2018 PSU Award | | 2/08/2016 | 2/08/2019 | | | | | 9,712 |
| 1,356,961 |
| 49,298 |
| $6,887,917 | | 2/13/2017 | 2/08/2019 | 7,805 |
| 1,090,515 |
| | | | 2017-2019 PSU Award | | 2/13/2017 | 2/08/2020 | | | | | 8,385 |
| 1,171,552 |
| 52,966 |
| 7,400,410 |
| | D. Caruso | Stock Options | | 2/09/2009 | 2/10/2012 | 110,578 |
| | 58.33 |
| 2/08/2019 | | | | | | 2/08/2010 | 2/09/2013 | 119,770 |
| 62.62 |
| 2/07/2020 | | 1/10/2011 | 1/11/2014 | 145,447 |
| 62.20 |
| 1/08/2021 | | 1/17/2012 | 1/18/2015 | 173,702 |
| 65.37 |
| 1/17/2022 | | 1/16/2013 | 1/17/2016 | 233,846 |
| 72.54 |
| 1/13/2023 | | 2/10/2014 | 2/11/2017 | 158,277 |
| 90.44 |
| 2/09/2024 | | 2/09/2015 | 2/10/2018 | | 136,535 |
| 100.06 |
| 2/09/2025 | | 2/08/2016 | 2/09/2019 | 142,365 |
| 101.87 |
| 2/08/2026 | | 2/13/2017 | 2/13/2020 | 131,264 |
| 115.67 |
| 2/13/2027 | | RSUs | | 2/09/2015 | 2/09/2018 | | | | | 10,601 |
| 1,481,172 |
| | | | 2/08/2016 | 2/08/2019 | 10,239 |
| 1,430,593 |
| | 2/13/2017 | 2/13/2020 | 11,045 |
| 1,543,207 |
| | 2015-2017 PSU Award | | 2/09/2015 | 2/09/2018 | | | | | 29,767 |
| 4,159,045 |
| | | | 2/08/2016 | 2/09/2018 | 3,481 |
| 486,365 |
| | 2/13/2017 | 2/09/2018 | 2,798 |
| 390,937 |
| | 2016-2018 PSU Award | | 2/08/2016 | 2/08/2019 | | | | | 3,362 |
| 469,739 |
| 17,066 |
| 2,384,462 |
| | 2/13/2017 | 2/08/2019 | 2,702 |
| 377,523 |
| | | | 2017-2019 PSU Award | | 2/13/2017 | 2/13/2020 | | | | | 2,916 |
| 407,424 |
| 18,408 |
| 2,571,966 |
|
| | | | 2018 Proxy Statement - 76
| | |
| | | | | | | | | | | | | | | | | | | | A | B | C | D | E | F | G | H | I | J | K | | | | | Options | Stock Awards | Number of Securities Underlying Unexercised Options (#) | Option Exercise Price ($) | Option Expiration Date | Number of Shares or Units of Stock that Have Not Vested (#) | Market Value of Shares or Units of Stock that Have Not Vested ($) | Equity Incentive Plan Awards: Number of Unearned Shares, Units, or Other Rights That Have Not Vested (#) | Equity Incentive Plans: Market or Payout Value of Unearned Shares, Units or Other Rights That Have Not Vested ($) | | Name | Grant Date | Vesting Date | Exercisable | Unexercisable | | S. Peterson | Stock Options | | 1/16/2013 | 1/17/2016 | 61,538 |
| | $72.54 | 1/13/2023 | | | | | | 2/10/2014 | 2/11/2017 | 162,509 |
| 90.44 |
| 2/09/2024 | | 2/09/2015 | 2/10/2018 | | 147,395 |
| 100.06 |
| 2/09/2025 | | 2/08/2016 | 2/09/2019 | 153,685 |
| 101.87 |
| 2/08/2026 | | 2/13/2017 | 2/13/2020 | 138,982 |
| 115.67 |
| 2/13/2027 | | RSUs | | 2/09/2015 | 2/09/2018 | | | | | 11,445 |
| $1,599,095 |
| | | | 2/08/2016 | 2/08/2019 | 11,053 |
| 1,544,325 |
| | 2/13/2017 | 2/13/2020 | 70,733 |
| 9,882,815 |
| | 2/13/2017 | 2/13/2020 | 11,695 |
| 1,634,025 |
| | 2015 - 2017 PSU Award | | 2/09/2015 | 2/09/2018 | | | | | 32,134 |
| 4,489,762 |
| | | | 2/08/2016 | 2/09/2018 | 3,758 |
| 525,068 |
| | 2/13/2017 | 2/09/2018 | 3,020 |
| 421,954 |
| | 2016 - 2018 PSU Award | | 2/08/2016 | 2/08/2019 | | | | | 3,630 |
| 507,184 |
| 18,422 |
| $2,573,922 | | 2/13/2017 | 2/08/2019 | 2,917 |
| 407,563 |
| | | | 2017 - 2019 PSU Award | | 2/13/2017 | 2/13/2020 | | | | | 3,088 |
| 431,455 |
| 19,490 |
| 2,723,143 |
| | J. Duato | Stock Options | | 2/09/2009 | 2/10/2012 | 5,130 |
| | 58.33 |
| 2/08/2019 | | | | | | 1/10/2011 | 1/11/2014 | 19,293 |
| 62.20 |
| 1/08/2021 | | 1/17/2012 | 1/18/2015 | 100,000 |
| 65.37 |
| 1/17/2022 | | 1/16/2013 | 1/17/2016 | 148,538 |
| 72.54 |
| 1/13/2023 | | 2/10/2014 | 2/11/2017 | 130,969 |
| 90.44 |
| 2/09/2024 | | 2/09/2015 | 2/10/2018 | | 126,369 |
| 100.06 |
| 2/09/2025 | | 2/08/2016 | 2/09/2019 | 125,824 |
| 101.87 |
| 2/08/2026 | | 2/13/2017 | 2/13/2020 | 123,291 |
| 115.67 |
| 2/13/2027 | | RSUs | | 2/09/2015 | 2/09/2018 | | | | | 9,812 |
| 1,370,933 |
| | | | 2/08/2016 | 2/08/2019 | 9,049 |
| 1,264,326 |
| | 2/13/2017 | 2/13/2020 | 70,733 |
| 9,882,815 |
| | 2/13/2017 | 2/13/2020 | 10,374 |
| 1,449,455 |
| | 2015 - 2017 PSU Award | | 2/09/2015 | 2/09/2018 | | | | | 27,549 |
| 3,849,146 |
| | | | 2/08/2016 | 2/09/2018 | 3,222 |
| 450,178 |
| | 2/13/2017 | 2/09/2018 | 2,590 |
| 361,875 |
| | 2016 - 2018 PSU Award | | 2/08/2016 | 2/08/2019 | | | | | 2,972 |
| 415,248 |
| 15,082 |
| 2,107,257 |
| | 2/13/2017 | 2/08/2019 | 2,388 |
| 333,651 |
| | | | 2017 - 2019 PSU Award | | 2/13/2017 | 2/13/2020 | | | | | 2,738 |
| 382,553 |
| 17,290 |
| 2,415,759 |
|
Executive contributions in last fiscal year (column B) | | | | | | 2018 Proxy Statement - 77
|
| | | | | | | | | | | | | | | | | | | | A | B | C | D | E | F | G | H | I | J | K | | | | | Options | Stock Awards | Number of Securities Underlying Unexercised Options (#) | Option Exercise Price ($) | Option Expiration Date | Number of Shares or Units of Stock that Have Not Vested (#) | Market Value of Shares or Units of Stock that Have Not Vested ($) | Equity Incentive Plan Awards: Number of Unearned Shares, Units, or Other Rights That Have Not Vested (#) | Equity Incentive Plans: Market or Payout Value of Unearned Shares, Units or Other Rights That Have Not Vested ($) | | Name | Grant Date | Vesting Date | Exercisable | Unexercisable | | P. Stoffels | Stock Options | | 2/10/2014 | 2/11/2017 | 155,342 |
| | $90.44 | 2/09/2024 | | | | | | 2/09/2015 | 2/10/2018 | | 170,668 |
| 100.06 |
| 2/09/2025 | | 2/08/2016 | 2/09/2019 | 174,787 |
| 101.87 |
| 2/08/2026 | | 2/13/2017 | 2/13/2020 | 138,982 |
| 115.67 |
| 2/13/2027 | | RSUs | | 2/09/2015 | 2/09/2018 | | | | | 13,252 |
| $1,851,569 |
| | | | 2/08/2016 | 2/08/2019 | 12,571 |
| 1,756,420 |
| | 2/13/2017 | 2/13/2020 | 11,695 |
| 1,634,025 |
| | 2015 - 2017 PSU Award | | 2/09/2015 | 2/09/2018 | | | | | 37,208 |
| 5,198,702 |
| | | | 2/08/2016 | 2/09/2018 | 4,352 |
| 608,061 |
| | 2/13/2017 | 2/09/2018 | 3,497 |
| 488,601 |
| | 2016 - 2018 PSU Award | | 2/08/2016 | 2/08/2019 | | | | | 4,128 |
| 576,764 |
| 20,952 |
| $2,927,413 | | 2/13/2017 | 2/08/2019 | 3,317 |
| 463,451 |
| | | | 2017 - 2019 PSU Award | | 2/13/2017 | 2/13/2020 | | | | | 3,088 |
| 431,455 |
| 19,490 |
| 2,723,143 |
|
Note: The PSUs that have been earned based on performance to date are included in columns H and I. See “2017 Update on Performance of Performance Share Unit Awards Versus Goals” on page 52 for details.
Market Value of Shares or Units of Stock That Have Not Vested (Columns I and K)
We calculated the market values of unvested PSUs and RSUs included in columns I and K using the closing price of our common stock on the NYSE on December 29, 2017, which was the last business day of fiscal 2017, of $139.72.
| | | | 2018 Proxy Statement - 78
| | |
Option Exercises and Stock Vested
In the table below, we show how many stock options each executive exercised in 2017 and the value received from exercising them. We also show how many PSUs and RSUs vested in 2017 and their value when they vested. | | | | | | | | | | | Option Awards | Stock Awards | | Name | Number of Shares Acquired on Exercise (#) | Value Realized Upon Exercise ($) | Number of Shares Acquired on Vesting (#) | Value Realized Upon Vesting ($) | | A. Gorsky | 0 |
| $0 | 151,654 |
| $17,523,609 | | D. Caruso | 82,591 |
| 6,067,135 |
| 48,478 |
| 5,601,630 |
| | S. Peterson | 0 |
| 0 |
| 49,773 |
| 5,751,267 |
| | J. Duato | 50,000 |
| 3,193,720 |
| 40,114 |
| 4,635,170 |
| | P. Stoffels | 102,692 |
| 6,445,977 |
| 123,070 |
| 16,031,788 |
|
Column B includes the amount the named executive officers deferred under the Executive Income Deferral Plan. This plan allows eligible employees to defer up to 50% of their base salary and 100% of their annual incentive. These amounts were included in columns C and F of the summary compensation table. | | | | | | 2018 Proxy Statement - 79
|
Pension Benefits
In the table below, we show the present value of pension benefits as of year-end 2017. For a complete understanding of the table, please read the description of the pension benefits that follow the table. | | | | | | | | | | | | | | | Present Value of Accumulated Benefit | | Name | Number of Years Credited Service (#) | Normal Retirement Age | Salaried Pension Plan ($) | Excess Pension Plan ($) | Total ($) | | A. Gorsky | 25.41 |
| 62 |
| $1,293,000 | $24,817,000 | $26,110,000 | | D. Caruso | 18.00 |
| 62 |
| 994,000 |
| 8,682,000 |
| 9,676,000 |
| | S. Peterson | 5.08 |
| 62 |
| 268,000 |
| 2,248,000 |
| 2,516,000 |
| | J. Duato | 28.25 |
| 62 |
| 1,320,000 |
| 10,624,000 |
| 11,944,000 |
| | P. Stoffels | 24.33 |
| 62 |
| 1,134,000 |
| 10,998,000 |
| 12,132,000 |
|
We calculated the present values included in the table using the same assumptions we used for the pension liabilities included in our 2017 Annual Report. We used a discount rate of 3.74% and mortality assumptions according to the RP-2014 White Collar table with generational improvements projected according to Scale MMP-2016.
The named executive officers participate in the same defined benefit pension plans provided to other U.S. non-union employees hired before January 1, 2015. We did not make any payments to our named executive officers from our pension plans in 2017.
We describe our U.S. pension formula and pension plans below:
U.S. Pension Formula: Our U.S. pension formula determines a monthly annuity amount payable for life.
Retirement Age: At age 62 employees can begin receiving unreduced pension payments. At age 55 they can begin receiving reduced pension benefits. If an employee begins receiving his or her pension before age 62, the pension is reduced by 4% per year for each year before age 62.
Monthly Annuity Amount: We calculate the monthly annuity amount as:
Registrant contributions in last fiscal year (column C) | | (1) | Final average earnings multiplied by 1.667%, multiplied by years of service prior to 2005, plus |
| | (2) | Final average earnings multiplied by 1.55%, multiplied by years of service after 2004, minus |
| | (3) | Age 65 Social Security benefits multiplied by 1.429%, multiplied by total years of service. |
Final Average Earnings: Final average earnings is the average of the highest consecutive 60 months out of the last 120 months of pay. Pay includes: base salary, bonus, and dividend equivalents paid or deferred on unvested CLCs for years prior to 2009.
Benefits Paid as an Annuity: Pension benefits must be taken in the form of an annuity, except the Belgian portion of Dr. Stoffels’ benefit which is payable as a lump sum at retirement.
Pension Plans: We pay our U.S. pensions from the Salaried and Excess Pension Plans as follows:
Salaried Pension Plan: The Salaried Pension Plan applies the U.S. pension formula to pay up to the IRS’s covered compensation limit. The limit was $270,000 in 2017.
Excess Pension Plan: The Excess Pension Plan uses the U.S. pension formula without applying the IRS pay limits. Its payments are reduced by amounts paid from the Salaried Pension Plan. U.S. non-union employees participate in the Excess Pension Plan if their covered compensation exceeds the IRS limit.
Offset for non-U.S. Pensions: Because Dr. Stoffels has worked in both Belgium and the U.S., his pension includes benefits from both the U.S. and Belgian Plans. The U.S. portion is calculated using the U.S. formula above for all service and subtracting the amount earned in the Belgian Plan. This treatment of service rendered outside the U.S. applies to all participants in the Salaried Plan who were hired before January 1, 2015 and who earned company service outside the U.S. before joining the U.S. pension plan on, or before, July 1, 2015.
| | | | 2018 Proxy Statement - 80
| | |
Non-Qualified Deferred Compensation
In the table below, we show our named executive officers’ year-end non-tax-qualified compensation deferral plan balances. We also show how much they and the company contributed to the plans and the earnings on the deferred compensation during the year. For a complete understanding of the table, please read the descriptions of the columns that follow the table.
| | | | | | | | | | | A | B | C | D | E | | Name | Executive Contributions in Last FY ($) | Registrant Contributions in Last FY ($) | Aggregate Earnings in Last FY ($) | Aggregate Balance at Last FYE ($) | | A. Gorsky | $0 | $59,850 | $565,095 | $11,006,891 | | D. Caruso | 0 |
| 29,817 |
| 1,228,208 |
| 19,110,703 |
| | S. Peterson | 0 |
| 35,437 |
| 27,605 |
| 188,123 |
| | J. Duato | 0 |
| 28,226 |
| 503,701 |
| 10,295,972 |
| | P. Stoffels | 0 |
| 40,636 |
| 545,505 |
| 11,129,104 |
|
Executive Contributions in Last Fiscal Year (Column B)
Column B includes the amount the named executive officers deferred under the Executive Income Deferral Plan. This plan allows eligible employees to defer up to 50% of their base salary and 100% of their annual performance bonus.
Registrant Contributions in Last Fiscal Year (Column C)
Column C includes company contributions to the named executive officer’s Excess Savings Plan accounts.
Aggregate Earnings in Last Fiscal Year (Column D)
Column C includes Company contributions to the named executive officer’s Excess Savings Plan accounts. These amounts are included in column H of the summary compensation table. Aggregate earnings in last fiscal year (column D) Column D includes earnings on the Executive Income Deferral Plan and Excess Savings Plan. It also includes the change in value of vested certificates of long-term compensation (CLCs). We show each of these amounts and the total earnings in the table on page 108. See details on CLC unit values on page 109. The earnings or losses on the Executive Income Deferral Plan and Excess Savings Plan balances are based on market rates of return as described on page 96. Therefore, there are no above-market earnings from these plans and the amounts are not included in column G of the summary compensation table. The changes in value of the CLCs are included in column G of the summary compensation table but only to the extent that the unit value grows at a rate that exceeds a reference rate of return. See page 96 for details.
| | | | | | | | | | | | | | | | Name | Earnings/(losses) on Executive
Income Deferral Plan
($) | Earnings/(losses) on Excess Savings Plan
($) | Change in
value of vested CLCs
($) | Total
($) | | J. Duato | $0 | $98,344 | $133,300 | $231,644 | | J. Wolk | 19,635 | 33,979 | 3,440 | 57,054 | | J. Reed | 0 | 1,512 | 0 | 1,512 | | J. Taubert | 1,226,654 | 58,335 | 32,250 | 1,317,239 | | P. Fasolo | 0 | 46,061 | 0 | 46,061 | | A. McEvoy | 0 | 63,984 | 38,700 | 102,684 |
Aggregate withdrawals / distributions (column E) There were no withdrawals or distributions in 2023. Aggregate balance at last fiscal year-end (column F) Column F includes the Executive Income Deferral Plan and Excess Savings Plan balances. It also includes the value of all vested CLCs (calculated using the end of year unit values). The amounts below were reported as compensation to the named executive officers in previous summary compensation tables to the extent required. See details on CLC unit values on page 109. | | | | | | | | | | | | | | | | Name | Executive Income Deferral Plan balance
($) | Excess Savings Plan balance
($) | Value of vested CLCs
($) | Total
($) | | J. Duato | $0 | $761,201 | $8,332,800 | $9,094,001 | | J. Wolk | 351,674 | 248,029 | 215,040 | 814,743 | | J. Reed | 0 | 24,479 | 0 | 24,479 | | J. Taubert | 7,072,595 | 451,964 | 2,016,000 | 9,540,559 | | P. Fasolo | 0 | 356,460 | 0 | 356,460 | | A. McEvoy | 0 | 447,351 | 2,419,200 | 2,866,551 |
•Executive Income Deferral Plan (EIDP) and Deferred Compensation Plan (DCP). Our executive officers could elect to defer up to 50% of their base salary and 100% of their annual incentive earned in 2023 under the EIDP. In November 2023, the company adopted the DCP, a non-qualified deferred compensation plan that will continue to allow our executive officers to defer up to 50% of their base salary and 100% of their annual incentive earned in 2024 and future years. In connection with the adoption of the DCP, no further initial deferral elections may be made under the EIDP. •Earnings. The deferred amounts under these plans are credited with earnings equal to the return on the investment options available under the Johnson & Johnson 401(k) Savings Plan (excluding company stock funds). The participant elects the allocation of their notional account balance among these alternatives. •Distributions. Amounts under the EIDP are generally paid in a lump sum on the later of six months following separation from service or in January of the year following separation. In connection with the adoption of the DCP, the Committee amended the EIDP to permit participants to change the time and form of payment of their EIDP account balances upon separation from service to the payment forms available under the DCP (which permits payment in the form of a lump sum or up to 10 annual installments), subject to compliance with applicable tax rules.
•Excess Savings Plan. Our 401(k) Savings Plan provides a matching contribution of 4.5% of base salary to employees who contribute at least 6% of base salary. The base salary covered under this plan is limited by the IRS’s covered compensation limit. The limit was $330,000 in 2023. The Excess Savings Plan credits an unfunded account with 4.5% of the amount of the base salary over the IRS limit. •Earnings. The accounts were credited with earnings equal to the return on each named executive officer's default target- date fund as determined by birth year. The average full year return for the group was 15.73%. •Distribution. Account balances will be paid out in a lump sum six months after termination, unless the participant made an irrevocable deferral or installment election before December 15, 2008. | | | | | | | | | | | | | | | | | Details on CLC unit values | | | | | | | | | | The following table includes the beginning and end of year CLC unit values. It also includes the change in unit value on vested CLCsduring the year. | | | | | | | Unit values and CLPs. We show eachchange in values | CLC
($) | | | Beginning of these amounts and the total earningsyear unit value | $52.90 | | | End of year unit value | $53.76 | | | Change in the table below. See details on CLC and CLP unit values on page 82.value | $0.86 | | | | | | | | | |
| | | | | | | | | | | | | Name | Earnings / (Losses) on Executive Income Deferral Plan ($) | Earnings / (Losses) Excess Savings Plan ($) | Change in Value of Vested CLCs ($) | Change in Value of Vested CLPs ($) | Total ($) | | A. Gorsky | $0 | $99,722 | $267,600 | $197,773 | $565,095 | | D. Caruso | 388,891 |
| 90,029 |
| 535,200 |
| 214,088 |
| 1,228,208 |
| | S. Peterson | 0 |
| 27,605 |
| 0 |
| 0 |
| 27,605 |
| | J. Duato | 0 |
| 53,113 |
| 345,650 |
| 104,938 |
| 503,701 |
| | P. Stoffels | 0 |
| 60,153 |
| 356,800 |
| 128,552 |
| 545,505 |
|
| | | | | | 2023 Potential payments upon termination We pay earned and unpaid compensation to our employees upon termination. In addition, depending upon the circumstances of the termination and the employee’s age and years of service, we pay severance, provide continued health benefit coverage and provide continued vesting in equity incentives. We have no change-in-control benefits. •Earned but unpaid compensation. Upon any termination of employment as of year-end 2023, employees would receive their 2023 annual incentive and vested non-qualified deferred compensation. They would also be entitled to their pension benefits upon retirement. If a named executive officer had terminated as of year-end 2023, he or she would have received his or her: •Earned but unpaid annual incentives for 2023. An employee must be employed through the end of the year to be eligible for a non-pro-rated annual incentive payout. However, in case of involuntary termination for cause, these amounts would be forfeited. See non-equity incentive plan compensation in the table on page 94 for the annual incentive amounts. •Vested non-qualified deferred compensation balances. See non-qualified deferred compensation — aggregate balance at last fiscal year-end (column F) in the table on page 108 for the year-end balances. •Pension benefits upon retirement. See 2023 pension benefits on page 105 for details. •Severance, healthcare coverage and equity incentives. In the table on page 111, we show the value of cash severance, continued healthcare coverage and continued vesting in equity incentives as if the named executive officers had terminated as of year-end 2023 under the circumstances shown below. For a complete understanding of the table please read the descriptions of the types of payments that follow the table. •No change-in-control benefits. We do not have any change-in-control agreements or arrangements in place for any of our named executive officers. Our 2022 Long-Term Incentive Plan only provides for a change-in-control benefit in the event that outstanding awards granted under the plan are not assumed or substituted by the acquirer in connection with a change-in-control, in which case the awards will vest and any performance conditions will be deemed to be achieved at the greater of target or actual performance levels as of the date of the change-in-control. If outstanding awards are assumed or substituted, the awards will remain outstanding and will continue to vest following the change-in-control. 2018 Proxy Statement - 81
|
| | | | | | | | | | | | | | | | | | | | | | Name | Type of payment | Voluntary
termination
($) | Involuntary
termination
without
cause
($) | Involuntary
termination
with cause
($) | Death
($) | Disability
($) | | J. Duato | Cash severance | $0 | $2,092,308 | $0 | $0 | $0 | | Healthcare coverage | 139,000 | 144,000 | 139,000 | 73,000 | 195,000 | | Equity incentives | 19,268,519 | 19,268,519 | 0 | 19,268,519 | 19,268,519 | | Total | 19,407,519 | 21,504,827 | 139,000 | 19,341,519 | 19,463,519 | | J. Wolk | Cash severance | 0 | 1,170,000 | 0 | 0 | 0 | | Healthcare coverage | 198,000 | 205,000 | 198,000 | 103,000 | 253,000 | | Equity incentives | 12,572,586 | 12,572,586 | 0 | 12,572,586 | 12,572,586 | | Total | 12,770,586 | 13,947,586 | 198,000 | 12,675,586 | 12,825,586 | | J. Reed | Cash severance | 0 | 1,150,000 | 0 | 0 | 0 | | Healthcare coverage | 0 | 19,000 | 0 | 10,000 | 22,000 | | Equity incentives | 0 | 0 | 0 | 11,875,406 | 11,875,406 | | Total | 0 | 1,169,000 | 0 | 11,885,406 | 11,897,406 | | J. Taubert | Cash severance | 0 | 1,150,000 | 0 | 0 | 0 | | Healthcare coverage | 141,000 | 149,000 | 141,000 | 76,000 | 219,000 | | Equity incentives | 11,626,502 | 11,626,502 | 0 | 11,626,502 | 11,626,502 | | Total | 11,767,502 | 12,925,502 | 141,000 | 11,702,502 | 11,845,502 | | P. Fasolo | Cash severance | 0 | 890,000 | 0 | 0 | 0 | | Healthcare coverage | 119,000 | 127,000 | 119,000 | 64,000 | 196,000 | | Equity incentives | 6,912,235 | 6,912,235 | 0 | 6,912,235 | 6,912,235 | | Total | 7,031,235 | 7,929,235 | 119,000 | 6,976,235 | 7,108,235 |
Terminations due to a reduction in force or specified divestiture Our unvested outstanding PSUs and our options and RSUs granted prior to February 13, 2023 are subject to special provisions in the event of a termination due to a reduction in force (RIF) or specified divestiture (as detailed on page 84). As of December 29, 2023, each continuing named executive officer was eligible for qualifying separation treatment of their long-term incentives. For these executives: •Termination due to a RIF would result in amounts equal to those in the involuntary termination without cause column of the potential payments upon termination table above. •Termination due to a specified divestiture would result in amounts equal to those in the involuntary termination without cause column, except they would not receive severance.
Cash severance Our severance pay plan provides benefits to certain full-time U.S. employees who are involuntarily terminated. We provide two weeks base salary for each year of service, with guaranteed minimums based on an employee’s level. The minimum for our named executive officers is 52 weeks of base salary. We pay severance according to our normal payroll cycle. We do not pay severance as a lump-sum payment. In order to receive the full number of weeks of base salary under our severance pay plan, U.S. employees must sign a release agreement and comply with the conditions set forth in the agreement, which may include compliance with non-competition provisions, release of all claims and rights, and any other terms set forth in the agreement. If U.S. employees do not sign the release agreement, the severance amount is four weeks of base salary. In the table below, we show how the cash severance amounts in the table on page 111 were calculated. | | | | | | | | | | | | | | | | | | | | | | Name | Salary rate as
of year-end
($) | Years of
eligible service
(#) | Weeks of base salary continuation | Total amount
of cash
severance
($) | Accrued
(#) | Minimum
(#) | Final
(#) | | J. Duato | $1,600,000 | 34 | 68 | 52 | 68 | $2,092,308 | | J. Wolk | 1,170,000 | 25 | 50 | 52 | 52 | 1,170,000 | | J. Reed | 1,150,000 | 0 | 0 | 52 | 52 | 1,150,000 | | J. Taubert | 1,150,000 | 18 | 36 | 52 | 52 | 1,150,000 | | P. Fasolo | 890,000 | 16 | 32 | 52 | 52 | 890,000 |
Healthcare coverage Upon termination of employment, all non-union U.S. employees receive continued healthcare coverage that varies based upon the termination circumstances. The healthcare coverage amounts in the table on page 111 are the present values of continued healthcare coverage. The values vary based upon the termination circumstances as follows: | | | | | | | | | | | | | | | | | | | | | | | | | Healthcare coverage | Eligibility | Eligible named executive officers | Voluntary termination | Involuntary termination without cause | Involuntary termination with cause | Death | Disability | | | | | | | | | | Retiree | Employees age 55 with ten years of service. | Duato Wolk Taubert Fasolo | | Begins at Last Fiscal Year-End (Column E) Column E includes the Executive Income Deferral Plan and Excess Savings Plan balances. It also includes the value of all vested CLCs and CLPs (calculated using the end of year unit values). See details on CLCthe cash severance period.
| | Coverage for dependents | | | | | | | | | | | | | | | | | | | Separation | Employees between ages 50 and CLP unit values below. | | | | | | | | | | | | | Name | Executive Income Deferral Plan Balance ($) | Excess Savings Plan Balance ($) | Value of Vested CLCs ($) | Value of Vested CLPs ($) | Total ($) | | A. Gorsky | $0 | $629,229 | $5,853,600 | $4,524,062 | $11,006,891 | | D. Caruso | 1,951,996 |
| 554,235 |
| 11,707,200 |
| 4,897,272 |
| 19,110,703 |
| | S. Peterson | 0 |
| 188,123 |
| 0 |
| 0 |
| 188,123 |
| | J. Duato | 0 |
| 334,624 |
| 7,560,900 |
| 2,400,448 |
| 10,295,972 |
| | P. Stoffels | 0 |
| 383,668 |
| 7,804,800 |
| 2,940,636 |
| 11,129,104 |
|
No 2017 Withdrawals: None of the named executive officers received any payments from our non-tax-qualified deferred compensation plans in 2017.
Executive Income Deferral Plan: Our executive officers can defer up to 50% of their base salary and 100% of their performance bonuses under the Executive Income Deferral Plan.
| | ◦ | Earnings: The deferred amounts are credited with earnings equal to the return on: Johnson & Johnson common stock, one-year Treasury Bills, or the investment options within our 401(k) Savings Plan. The participant elects the allocation among these alternatives.
|
For 2017, the return on our common stock for these participants was 24.88%. None of the named executive officers had amounts allocated to the one-year Treasury Bill alternative in 2017.
| | ◦ | Distribution: Amounts deferred after 2004 are paid on the later of six months after termination or January of the year following termination. Amounts deferred before 2005 can be paid up to 10 years after termination and be paid as a lump sum or in up to 15 annual installments.
|
Excess Savings Plan: Our 401(k) Savings Plan provides a matching contribution of 4.5% of base salary to employees who contribute at least 6% of base salary. The base salary covered under this plan is limited by the IRS’s covered compensation limit. The limit was $270,000 in 2017. The Excess Savings Plan credits an unfunded account54 with 4.5% of the amount of the base salary over the IRS limit.
| | ◦ | Earnings: The accounts are credited with earnings equal to the return on the Balanced Fund investment option within our 401(k) Savings Plan. In 2017, the rate of return was 20.31%.
|
| | ◦ | Distribution: Account balances will be paid out in a lump sum, six months after termination, unless the participant made an irrevocable deferral or installment election before December 15, 2008.
|
| | | | | | | Details on CLC and CLP Unit Values The following table includes the beginning and end of year CLC and CLP unit values. It also includes the change in unit values during the year.
| | | Unit Values and Change in Values | CLC ($) | CLP ($) | | | | Beginning of Year Unit Value | $46.55 | $5.25 | | | | End of Year Unit Value | 48.78 | 5.49 | | | | Change in Unit Value | 2.23 | 0.24 | | | | | | | | | | l | Impact of 2017 Tax Legislation: The Board approved amortizing the impact of the 2017 enacted tax legislation on the CLC and CLP values over 8 years consistent with the IRS payment duration (8% per year in years 1 through 5; 15% in year 6; 20% in year 7 and 25% in year 8). If the impact of the tax legislation were not amortized, the 2017 end of year CLC value would have been $40.65 and the 2017 end of year CLP value would have been $4.59. |
| | | | 2018 Proxy Statement - 82
| | |
Potential Payments Upon Termination
We pay earned and unpaid compensation to our employees upon termination as described below. In addition, depending upon the circumstances of the termination and the employee’s age andten years of service we pay severance, provide continued health benefit coverage, and provide continued vesting in equity incentives as described below. We have no change-in-control benefits.
Earned but Unpaid Compensation: Upon any termination of employment as of year-end 2017, employees would receive their annual performance bonus and vested non-qualified deferred compensation. They would also be entitled to their pension benefits upon retirement. If a named executive officer had terminated as of year-end 2017, he or she would have received his or her:
| | ◦ | Earned but unpaid annual performance bonuses for 2017. An employee must be employed through the end of the year to be eligible for a non-pro-rated bonus. However, in case of involuntary termination for cause, these amounts would be forfeited. See the “Non-Equity Incentive Plan Compensation” table on page 70 for the bonus amounts.
|
| | ◦ | Vested non-qualified deferred compensation balances. See the “Non-Qualified Deferred Compensation” table on page 81 for the year-end balances.
|
| | ◦ | Pension benefits upon retirement. See “Pension Benefits” on page 80 for details.
|
Severance, Healthcare Coverage, and Equity Incentives: In the table below, we show the value of cash severance, continued healthcare coverage, and continued vesting in equity incentives as if the named executive officers had terminated as of year-end 2017 under the circumstances shown below. For a complete understanding of the table please read the descriptions of the types of payments that follow the table.
No Change-in-Control Benefits: We do not have any change-in-control agreements or arrangements in place for any of our named executive officers. In addition, there are no change-in-control provisions in any of our compensation plans or instruments.
| | | | | | | | | | | | | | Name | Type of Payment | Voluntary Termination ($) | Involuntary Termination Without Cause ($) | Involuntary Termination with Cause ($) | Death ($) | Disability ($) | | A. Gorsky | Cash Severance | $0 | $1,600,000 | $0 | $0 | $0 | | | Healthcare Coverage | 248,000 |
| 251,000 |
| 248,000 |
| 128,000 |
| 292,000 |
| | | Equity Incentives | 92,073,285 |
| 92,073,285 |
| 0 |
| 92,073,285 |
| 92,073,285 |
| | | Total | 92,321,285 |
| 93,924,285 |
| 248,000 |
| 92,201,285 |
| 92,365,285 |
| | D. Caruso | Cash Severance | 0 |
| 1,152,985 |
| 0 |
| 0 |
| 0 |
| | | Healthcare Coverage | 172,000 |
| 176,000 |
| 172,000 |
| 90,000 |
| 211,000 |
| | | Equity Incentives | 30,917,509 |
| 30,917,509 |
| 0 |
| 30,917,509 |
| 30,917,509 |
| | | Total | 31,089,509 |
| 32,246,494 |
| 172,000 |
| 31,007,509 |
| 31,128,509 |
| | S. Peterson | Cash Severance | 0 |
| 1,072,500 |
| 0 |
| 0 |
| 0 |
| | | Healthcare Coverage | 0 |
| 14,000 |
| 0 |
| 4,000 |
| 242,000 |
| | | Equity Incentives | 0 |
| 0 |
| 0 |
| 43,082,053 |
| 43,082,053 |
| | | Total | 0 |
| 1,086,500 |
| 0 |
| 43,086,053 |
| 43,324,053 |
| | J. Duato | Cash Severance | 0 |
| 970,631 |
| 0 |
| 0 |
| 0 |
| | | Healthcare Coverage | 243,000 |
| 251,000 |
| 243,000 |
| 123,000 |
| 293,000 |
| | | Equity Incentives | 28,296,365 |
| 28,296,365 |
| 0 |
| 38,179,180 |
| 38,179,180 |
| | | Total | 28,539,365 |
| 29,517,996 |
| 243,000 |
| 38,302,180 |
| 38,472,180 |
| | P. Stoffels | Cash Severance | 0 |
| 1,178,300 |
| 0 |
| 0 |
| 0 |
| | | Healthcare Coverage | 241,000 |
| 249,000 |
| 241,000 |
| 122,000 |
| 292,000 |
| | | Equity Incentives | 36,782,026 |
| 36,782,026 |
| 0 |
| 36,782,026 |
| 36,782,026 |
| | | Total | 37,023,026 |
| 38,209,326 |
| 241,000 |
| 36,904,026 |
| 37,074,026 |
|
| | | | | | 2018 Proxy Statement - 83
|
Cash Severance
Our Severance Pay Plan provides benefits to certain full-time U.S. employees who are involuntarily terminated. We provide two weeks base salary for each yearterminated without cause.
|
| Not applicable | Begins at the earlier of service, with guaranteed minimums based on an employee’s level. The minimum for our named executive officers isthe cash severance period or 52 weeks of base salary. We payand ends at age 65. | Not applicable | Not applicable | Not applicable | | | | | | | | | | | | | | | | | | Active-employee | All employees. | Reed | No continued coverage | While on severance according- up to our normal payroll cycle. We do not pay severance as a lump-sum payment.52 weeks. | No
continued
coverage | In the table below, we show how the “Cash Severance” amounts in the preceding table were calculated.Coverage for dependents for 6 months.
| | | | | | | | | | | | | | | | Name | Salary Rate as of Year End ($) | Years of Eligible Service (#) | Weeks of Base Salary Continuation | Total Amount of Cash Severance ($) | Accrued (#) | Minimum (#) | Final (#) | | A. Gorsky | $1,600,000 | 9 |
| 18 |
| 52 |
| 52 |
| $1,600,000 | | D. Caruso | 936,800 |
| 32 |
| 64 |
| 52 |
| 64 |
| 1,152,985 |
| | S. Peterson | 1,072,500 |
| 5 |
| 10 |
| 52 |
| 52 |
| 1,072,500 |
| | J. Duato | 901,300 |
| 28 |
| 56 |
| 52 |
| 56 |
| 970,631 |
| | P. Stoffels | 1,178,300 |
| 20 |
| 40 |
| 52 |
| 52 |
| 1,178,300 |
|
Healthcare Coverage
Upon termination of employment, all non-union U.S. employees receive continued healthcare coverage that varies based upon the termination circumstances. The “Healthcare Coverage” amounts in the tableWhile on page 83 are the present values of continued healthcare coverage. The values vary based upon the termination circumstances as follows:
| | | | | | | | | Healthcare Coverage | Eligibility | Eligible Named Executive Officers | Voluntary
Termination
| Involuntary
Termination
Without Cause
| Involuntary Termination
with Cause
| Death | Disability | Retiree | Employees age 55 with ten years of service | Gorsky
Caruso
Duato
Stoffels
| ü | ü
Begins at the end of the cash severance period
| ü
| ü
Coverage for Dependents
| ü
| Separation | Employees between ages 50 and 54 with ten years of service who are involuntarily terminated without cause | | Not Applicable | ü
Begins at the earlier of the end of the cash severance period or 52 weeks and ends at age 65
| Not Applicable | Not Applicable | Not Applicable | Active-employee | All Employees | Peterson | No continued coverage | ü
While on severance - up to 52 weeks
| No continued coverage | ü
Coverage for Dependents for 6 months
| ü
While on Long-term disabilitylong-term disability.
|
Equity Incentives
The “Equity Incentive” amounts in the table on page 83 are the value of unvested equity incentives as of year-end 2017. The values vary based upon the termination circumstances as described under “Long-Term Incentive Vesting and Treatment upon Termination” on page 59.
The special retention award of 70,733 RSUs granted to Mr. Duato on February 13, 2017 is not eligible for qualifying separation treatment. Therefore, its value is not included in the "voluntary termination" and "involuntary termination without cause" scenarios.
| | | | | | | | |
Note: " " means eligible for coverage. " means eligible for coverage. | | | | 2018 Proxy Statement - 84
| | |
Equity incentives The Equity incentives amounts in the table on page 111 are the value of unvested equity incentives as of year-end 2023. The values vary based upon the termination circumstances as described under long-term Incentive vesting and treatment upon termination on page 82. MedTech chairman transition Ashley McEvoy served as Executive Vice President, Worldwide Chairman, MedTech until October 20, 2023, and served in an advisory role until she left the Company in February 2024. In consideration for her service, she earned a salary of $1,059,231 in 2023. She also was eligible for, and received, an annual incentive payment for her 2023 performance of $1,050,000. She did not receive a February 2024 LTI award for 2023 performance or any severance payments or benefits in connection with her departure. Upon termination of her employment, she forfeited outstanding long-term incentive awards that had not vested per the terms and conditions of each outstanding award. Ratio of the annual total compensation of the median-paid employee to the CEO The annual total compensation of our median-paid employee on a worldwide basis for 2023 was $84,000. The annual total compensation of our chief executive officer for 2023 was $28,422,037. The ratio of the two amounts for 2023 is 338 to 1 . We used the following methodology and assumptions to calculate the annual total compensation of the median-paid employee: •We included 100% of our employees (other than our Chief Executive Officer) in the calculation of median, as follows: •We gathered payroll data from 24 countries around the world, which account for 93% of our employees. •We assumed that the remaining 7% of our employees not included in this database are paid less than the median. This is a conservative assumption. If any of the employees assumed to be below the median were paid higher than the calculated median, the actual median would be higher. •We calculated the annual total compensation and ranked our employees using: taxable cash earnings, which includes salary, wages (regular, hourly, overtime, shift differentials), commissions, annual incentives and other miscellaneous cash earnings; the estimated value of the Company-provided pension earned during 2023 and Company contributions to defined contribution retirement plans during 2023 (using an estimated percentage of salary for each country where we have a Company-provided retirement plan); and the estimated value of Company-provided medical and dental insurance coverage using an estimated per-employee amount for each country where we have Company-provided medical and dental plans. •Using our year-end 2023 total employee count, we counted down from the top to identify the median-paid employee. At least 50% of our employees have annual total compensation amounts higher than $84,000. •We rounded the annual total compensation of the median-paid employee to the nearest thousand dollars. The annual total compensation of our chief executive officer for 2023 is the $28,397,240 total as reported in the summary compensation table on page 92 plus healthcare benefits of $24,797. The ratio of the annual total compensation of the median-paid employee to the CEO is calculated by dividing the annual total compensation of our chief executive officer by that of our median-paid employee. Because the annual total compensation of the median-paid employee is a conservative estimate (as described above), the pay ratio is also a conservative estimate – the actual ratio could be lower but not higher. Comparison to 2022 median-paid annual total compensation The annual total compensation of our median-paid employee for 2022 was $80,000. The median for 2023 is $84,000. Salary increases and other increases in compensation contributed to the increase in the median. The net effect of changes in currency exchange rates had a negative impact on the year-on-year increase in the median. If the exchange rates had not changed during 2023, the median would have been $88,000.
Ratio of the Annual Total Compensation of the Median-Paid Employee to the CEO
The annual total compensation of our median-paid employee on a worldwide basis for 2017 was $66,000. The annual total compensation of our Chief Executive Officer for 2017 was $29,802,564. The ratio of the two amounts for 2017 is 452 to 1. For a complete understanding of these amounts, please read the descriptions below.
We used the following methodology and assumptions to calculate the annual total compensation of the median-paid employee:
We gathered payroll data from 20 countries around the world, which account for 80% of our employees.
We assumed that employees not included in this database are paid less than the median. This is a conservative assumption. If any of the employees assumed to be below the median were paid higher than the calculated median, the actual median would be higher.
We calculated the annual total compensation and ranked our employees using their taxable cash earnings, which includes: salary, wages (regular, hourly, overtime, shift differentials), commissions, bonuses, other miscellaneous cash earnings, and the estimated value of the company-provided pension earned during 2017 (using an estimated percentage of salary for each country where we have a company-provided pension).
We counted down from the top to identify the median-paid employee. At least 50% of our employees have annual total compensation amounts higher than the amount shown in the table.
We rounded the annual total compensation of the median-paid employee to the nearest thousand dollars.
The annual total compensation of our Chief Executive Officer for 2017 is as reported in the Summary Compensation Table on page 68. The ratio of the Annual Total Compensation of the Median-Paid Employee to the CEO is calculated by dividing the annual total compensation of our Chief Executive Officer by that of our median-paid employee. Because the annual total compensation of the median-paid employee is a conservative estimate (as described above), the pay ratio is also a conservative estimate - the actual ratio could be lower, but not higher.
Pay versus performance In the table below, we show the compensation for our CEO (Principal Executive Officer, or PEO, in the table) and the average of the other named executive officers, our cumulative total shareholder return, net income and annual relative total shareholder return, and the cumulative total shareholder returns of our peer indices. Our executives’ compensation is shown using the totals from the summary compensation table and compensation actually paid (CAP) according to SEC rules. Pay versus performance table | | | | | | | | | | | | | | | | | | | | | | | | | | | | | | | A | B | C | D | E | F | G | H | I | J | | | | | | Value of initial fixed $100 investment based on: | | | | Year | Summary
compensation
table total for
PEO | Compensation
actually paid
to PEO | Average
summary
compensation
table total for
non-PEO NEOs | Average
compensation
actually paid
to non-PEO
NEOs | Total
shareholder
return | Peer group
total
shareholder
return (S&P
Pharmaceuticals
sub index) | Peer group
total
shareholder
return
(S&P
Healthcare
Equipment
sub index) | Net
income
($ millions) | Annual
relative
total
shareholder
return
(% points) | | 2023 | $28,397,240 | $13,839,320 | $12,492,559 | $7,116,002 | $119.65 | $147.13 | $124.22 | $35,153 | (18.6) | % | | 2022 | 13,099,487 | 18,910,984 | 8,021,796 | 11,882,576 | 130.91 | 146.65 | 113.92 | 17,941 | 5.6 | | | 2021 | 26,741,959 | 39,418,762 | 12,498,029 | 16,589,484 | 123.54 | 135.21 | 140.40 | 20,878 | (2.4) | | | 2020 | 29,575,974 | 28,993,387 | 12,948,370 | 11,481,071 | 110.85 | 107.53 | 117.63 | 14,714 | 1.6 | |
Summary compensation table total for PEO and average summary compensation table total for non-PEO NEOs (columns B and D) Column B includes the amounts reported in the total column of the summary compensation table for our CEO. Column D includes the average of the amounts reported in the total column of the summary compensation table for our named executive officers excluding our CEO. In the table below, we show which executives were included in columns B through E in 2020-2023. | | | | | | | | | | | | | | | | | | | | | | | | | | | | | | | Executive name | PEO | | Non-PEO NEO | | 2020 | 2021 | 2022 | 2023 | | 2020 | 2021 | 2022 | 2023 | | A. Gorsky | X | X | | | | | | | | | J. Duato | | | X | X | | X | X | | | | J. Wolk | | | | | | X | X | X | X | | P. Stoffels | | | | | | X | X | | | | J. Taubert | | | | | | X | X | X | X | | A. McEvoy | | | | | | | | X | X | | T. Mongon | | | | | | | | X | | | J. Reed | | | | | | | | | X | | P. Fasolo | | | | | | | | | X |
Compensation actually paid to PEO and average compensation actually paid to non-PEO NEOs (columns C and E) Columns C and E, respectively, include the amount of compensation actually paid to our CEO and average of our other NEOs (according to SEC rules). The amounts are not current cash payments. Our retirement benefits are paid only after retirement and our long-term incentives’ value vary with company performance (including stock price) until they are vested or exercised (in the case of options). The following table shows the 2023 adjustments made to total compensation for each year to determine the compensation actually paid: | | | | | | | | | | | | | | | | | | | | | | Executive | Summary
compensation
table total | Minus
summary
compensation
table value of
equity awards | Plus
pay versus
performance value
of equity awards | Minus
summary
compensation
table change
in the actuarial
present value of
pension benefits | Plus
pay versus
performance
value of
pension
benefits | Equals
compensation
actually paid | | PEO | $28,397,240 | $15,979,133 | $7,166,755 | $6,213,000 | $467,458 | $13,839,320 | | Average of Non-PEO NEOs | 12,492,559 | 7,194,626 | 2,966,942 | 1,424,000 | 275,127 | 7,116,002 |
•Summary compensation table value of equity awards includes the total grant date fair value of equity awards reported in the stock awards and option awards columns in the summary compensation table. •Pay versus performance value of equity awards includes the following: •For awards granted in the applicable year, the fair value: •At year-end for awards that are outstanding and unvested. •As of the vesting date for awards that vest in the applicable year. •For awards granted in prior years, the change in fair value: •From the beginning of the year to the end of the year for awards that remain outstanding and unvested. •From the beginning of the year to the vesting date for awards that vest in the applicable year. •From the beginning of the year to zero for awards that fail to vest. •Fair values as of each measurement date were determined using valuation assumptions and methodologies (including expected term, volatility, dividend yield and risk-free interest rates) that are consistent with those used to estimate fair value at grant under U.S. GAAP. The valuation assumptions used to calculate option fair values differed materially from those disclosed at the time of grant in the following ways: •Risk-free rates range from 3.8% to 4.0% for the pay-versus-performance valuations versus a range of 0.8% to 3.7% for grant-date valuations. The risk-free rates differed due to macroeconomic changes between the grant date and valuation dates. •The expected option term estimate ranges from 4.0 years to 6.1 years for the pay-versus-performance valuations versus 7.0 years for the grant-date valuations. The expected term decreased from the grant date as we considered potential changes in exercise behavior, as the options are no longer at-the-money, and to incorporate the passage of time in the award's life. •We calculated the estimated number of PSUs to vest in the future assuming: •2022-2024 PSUs tied to relative TSR performance vest at 71.2% of target and cumulative adjusted EPS performance vest at 108.9% of target. •2023-2025 PSUs tied to relative TSR performance vest at 0.0% of target and cumulative adjusted EPS performance vest at 119.2% of target. •All other valuation assumptions are not materially different from the grant-date assumptions and there were no changes in calculation methodology. See Common Stock, Stock Option Plans and Stock Compensation Agreements Note to the Consolidated Financial Statements of the Form 10-K for additional details on the valuation assumptions used at grant.
The following table shows the 2023 amounts included in the pay-versus-performance value of equity awards. | | | | | | | | | | | | | | | | Executive | Year-end fair value of equity awards granted during applicable year | Change in fair value as of year-end of any prior-year awards that remain unvested as of year-end | Change in fair value as of the vesting date of any prior-year awards that vested during applicable year | Pay versus performance value of equity awards | | PEO | $14,690,868 | $(5,539,650) | $(1,984,463) | $7,166,755 | | Average of Non-PEO NEOs | 6,723,208 | (2,836,480) | (919,786) | 2,966,942 |
•Summary compensation table change in the actuarial present value of pension benefits includes the changes in pension value reported in the change in pension and non-qualified deferred compensation column of the summary compensation table. •Pay versus performance value of pension benefits includes the following: •Service costs. The actuarially determined pension service cost for services rendered by our CEO or NEOs •Prior service costs. The entire cost of benefits granted (or credit for benefits reduced) in a plan amendment (or initiation) during the applicable year that is attributed by the benefit formula to services rendered in periods prior to the plan amendment or initiation. •The amounts deducted or added in calculating the 2023 pay versus performance value of pension benefits are as follows: | | | | | | | | | | | | | Executive | Service costs attributable to the applicable year | Prior service costs introduced during the applicable year | Pay versus
performance
value of
pension
benefits | | PEO | $467,458 | $0 | $467,458 | | Average of other NEOs | 275,127 | 0 | 275,127 |
Total shareholder return and peer group shareholder return (columns F, G and H) Columns F, G and H are the cumulative total shareholder return of a $100 investment from the beginning of fiscal year 2020 through the end of each of the years indicated for the Company (column F), the S&P Pharmaceuticals industry index (column G) and the S&P Healthcare Equipment industry index (column H). Total shareholder return includes share price appreciation and assumes dividend reinvestment. Net income (column I) Column I includes the Company’s net income, in millions, as reported in the Company’s audited financial statements. Net income in 2020-2023 includes the Consumer Health business, which separated from Johnson & Johnson in August 2023 as Kenvue. Net income in 2023 also includes proceeds from the sale of Kenvue. Net Income from Continuing Operations, which would have excluded this business, would have been $17.801 billion, $16.370 billion and $13.326 billion for 2021, 2022 and 2023, respectively. Annual relative total shareholder return (column J) Column J includes the percentage point difference between the Company’s and the competitor composite peer group’s TSR for each fiscal year. We use three-year relative TSR as a PSU performance measure to link compensation actually paid to our executives to Company performance. We include one-year relative TSR in the table because it impacts the three overlapping PSU performance cycles that are outstanding each year. Furthermore, the SEC’s guidance precludes using multi-year performance measurement periods for the performance measures in the table. 2018 Proxy Statement - 85
Financial performance measures The financial metrics we use in our annual and long-term incentive plans are our most important financial measures. As described in Components of executive compensation on page 65, our annual incentives are designed to motivate attainment of our near-term priorities, consistent with our long-term strategic plan. Our long-term incentives are designed to motivate attainment of our long-term goals, TSR and share price growth, as well as retain executives. | | | | | | Annual incentive
financial performance measures | Long-term incentive
financial performance measures | •Operational sales. | •Three-year cumulative adjusted operational EPS. |
•Adjusted operational EPS growth.
| •Three-year TSR compound annual growth rate versus the competitor composite peer group. | •Free cash flow. | | | •Share price appreciation. | |
Note: Operational sales, adjusted operational EPS, free cash flow and cumulative adjusted operational EPS are non-GAAP measures. See pages 86 to 88 for details. We use three-year relative TSR as a PSU performance measure. However, SEC guidance limits the company selected measure included in the last column of the pay versus performance table to one-year periods. So, we compare CAP to annual relative TSR in our analysis of the information presented in the pay versus performance table on page 119. Annual relative TSR directly impacts the three overlapping PSU performance cycles that are outstanding each year. Our annual incentives also include our strategic goals that cover a range of items critical to both our short- and long-term success. We prioritize excellence in our operational execution, product development and pipeline growth, our employees, key strategic initiatives that enable our continued growth and performance against our purpose-driven objectives. We describe our performance against our 2023 strategic goals on page 68. Analysis of the information presented in the pay versus performance table We describe the relationships between compensation actually paid and the Company’s cumulative TSR, net income and annual relative TSR beginning on page 118. We also compare the Company’s cumulative TSR with the peer indices. Changes in PEO and NEOs from 2021-2022 It is important to keep in mind that our CEO and named executive officers have changed, making year-to-year comparisons of compensation actually paid difficult. Most significant is our change in CEO. For 2020 and 2021, Mr. Gorsky was our CEO (PEO in the table) and for 2022 and 2023, Mr. Duato was our CEO. Components of compensation actually paid that vary with performance The components of compensation actually paid that vary with performance each year are our annual incentive payouts, the fair value of long-term incentive awards granted in each year and the change in fair value of equity awards during the year. The decisions regarding our annual incentive payouts are described in our 2021, 2022 and 2023 Proxy Statements and this Proxy Statement. The decisions regarding our long-term incentive awards are described in our 2020, 2021, 2022 and 2023 Proxy Statements. The addition of the change in fair value of equity awards during the year is the most significant performance-related difference between CAP and the totals reported in the summary compensation table. The change in fair value of equity awards during the year varies with our annual share price appreciation and performance against our PSU goals. We use multiple performance measures We use seven financial performance measures for our annual and long-term incentives. We also vary the sizes of our long-term incentive grants each year based on individual performance. Therefore, no single financial performance measure can fully describe changes in CAP, especially because most of the measures are compared to annual or three-year goals.
Compensation actually paid and cumulative TSR The chart below compares the compensation actually paid to our CEO and the average of our other NEOs with the Company’s cumulative TSR. As described on page 70, our three-year TSR relative to our competitor composite peers is one of our PSU performance measures. However, the Company’s cumulative TSR without a peer comparison is not one of the performance measures we use in our annual or long-term incentive plans. The Company’s cumulative TSR includes both our annual share price appreciation and the impact of reinvested dividends. Because most of our executives’ compensation is equity-based long-term incentives which vary in value with the Company’s price, our CAP is aligned with the annual share price appreciation component of TSR. Dividends confound the relationship because they are included in the cumulative TSR but are not included in CAP because we do not pay dividends on unvested equity awards. CAP vs. TSR Audit Committee Report | | | | | | | | | | | | | | | | | | | n | PEO CAP | n | Average for Non-PEO NEO | — | TSR |
Compensation actually paid and net income The chart on page 119 compares the compensation actually paid to our CEO and the average of our other NEOs with the Company’s net income. As described on pages 69 and 70, adjusted operational EPS is one of our annual incentive measures and three-year cumulative adjusted operational EPS is one of our PSU performance measures. These measures are compared to goals that we set at the beginning of each year for the annual incentives and at the beginning of each three-year performance period for the PSUs. While annual net income impacts our adjusted operational EPS and three-year cumulative adjusted operational EPS, it is not one of the performance measures we use in our annual or long-term incentive plans. Therefore, any relationship of CAP with the Company’s annual net income would be indirect, at best, because it is not a performance measure in our compensation program and it is not compared to any goals. Column I includes the Company’s net income, in millions, as reported in the Company’s audited financial statements. Net income in 2020-2023 includes the Consumer Health business, which separated from Johnson & Johnson in August 2023 as Kenvue. Net income in 2023 also includes proceeds from the sale of Kenvue. Net Income from Continuing Operations, which would have excluded this business, would have been $17.801 billion, $16.370 billion and $13.326 billion for 2021, 2022 and 2023, respectively.
CAP vs. net income | | | | | | | | | | | | | | | | | | | n | PEO CAP | n | Average for Non-PEO NEO | — | Net income |
Compensation actually paid and annual relative total shareholder return The chart on page 120 compares the compensation actually paid to our CEO and the average of our other NEOs with the Company’s annual relative TSR. Annual relative TSR directly impacts the three overlapping PSU performance cycles that are outstanding each year. Higher annual relative TSR increases the fair value of the outstanding PSUs and conversely lower annual relative TSR decreases the fair value of outstanding PSUs. Performance against our annual incentive goals, three-year cumulative adjusted operational EPS PSU goals and changes in the fair value of long-term incentive awards granted each year confound the relationship of CAP and annual relative TSR because they are independent of annual relative TSR. Note: We use three-year relative TSR as a PSU performance measure. However, SEC guidance limits the measures to one-year periods.
CAP vs. annual relative TSR | | | | | | | | | | | | | | | | | | | n | PEO CAP | n | Average for Non-PEO NEO | — | Annual relative TSR |
Annual relative TSR | | | | | | | | | | | | | | | | TSR | 2020 | 2021 | 2022 | 2023 | | Johnson & Johnson | 9.3 | % | 12.8 | % | 8.0 | % | (8.6 | %) | | Competitor composite | 7.7 | | 15.2 | | 2.4 | | 10.0 | | | One-year relative TSR | 1.6 | | (2.4) | | 5.6 | | (18.6) | |
The TSR for each of the business groups within the competitor composite peer group is weighted based on the Company’s sales mix for the prior year as shown in the table below. Following the separation of our Consumer Health business, the Consumer Health group was removed from the Competitor Composite Peer Group. See page 81 for additional details. Competitor composite peer group weightings | | | | | | | | | | | | | | | | | | | Business group | 2020 | 2021 | 2022 | 2023
(Pre-Kenvue separation) | 2023
(Post-Kenvue separation) | | Innovative Medicine | 51.4 | % | 54.7 | % | 55.1 | % | 55.4 | % | 65.7 | % | | MedTech | 31.6 | | 27.8 | | 28.9 | | 28.9 | | 34.3 | | | Consumer Health | 16.9 | | 17.5 | | 16.0 | | 15.7 | | 0.0 | | | Total | 100.0 | | 100.0 | | 100.0 | | 100.0 | | 100.0 | |
Note: Sum of individual components may not reflect total weighting due to rounding. The TSR for each business group is weighted by the beginning of year market capitalization of each company. The companies in each business group are shown in the table on page 121.
Competitor composite peer group | | | | | | | | | | Innovative Medicine | MedTech | Consumer Health
(Excluded After August 2023) | | AbbVie Inc. | Alcon, Inc. | Beiersdorf AG | | Amgen Inc. | Bausch & Lomb Inc. | Colgate-Palmolive Co | | AstraZeneca PLC | Boston Scientific Corporation | L'Oreal S.A. | | Bristol-Myers Squibb Company | The Audit Committee reports to and acts on behalf of the Board of Directors of the company by providing oversight of the financial management, internal auditors, independent auditor and financial reporting controls and accounting policies and procedures of the company. Cooper Companies, Inc. | The company’s management is responsible for preparing the company’s financial statements and systems of internal control and the independent auditor is responsible for auditing those financial statements and expressing its opinion as to whether the financial statements present fairly, in all material respects, the financial position, results of operations and cash flows of the company in conformity with generally accepted accounting principles. The Audit Committee is responsible for overseeing the conduct of these activities by the company’s management and the independent auditor.Procter & Gamble Company | | Eli Lilly & Company | Intuitive Surgical, Inc. | Reckitt Benckiser Group plc | | GlaxoSmithKline plc | Medtronic plc | Unilever PLC | | Merck & Co Inc | Smith & Nephew plc | | | Novartis AG | Stryker Corporation | | | Pfizer Inc | Zimmer Biomet Holdings, Inc | | | Roche Holding Ltd | | | | Sanofi | | |
Cumulative TSR of the company and cumulative TSR of the peer group The chart below compares the Company's cumulative TSR presented in the table with the cumulative TSR of our two peer indices: the S&P Pharmaceuticals Index and the S&P Healthcare Equipment Index. We do not use the cumulative TSR of the S&P Pharmaceuticals Index or S&P Healthcare Equipment index as incentive measures for our NEOs. However, we do measure three-year relative TSR versus our competitor composite peer group as one of our PSU metrics, as described in greater detail in our PSU goal setting process on page 70. So, the relationship of CAP with our three-year relative TSR versus our competitor composite peer group is direct for each of the overlapping PSU performance periods shown in the table. Cumulative TSR of the company and peer groups 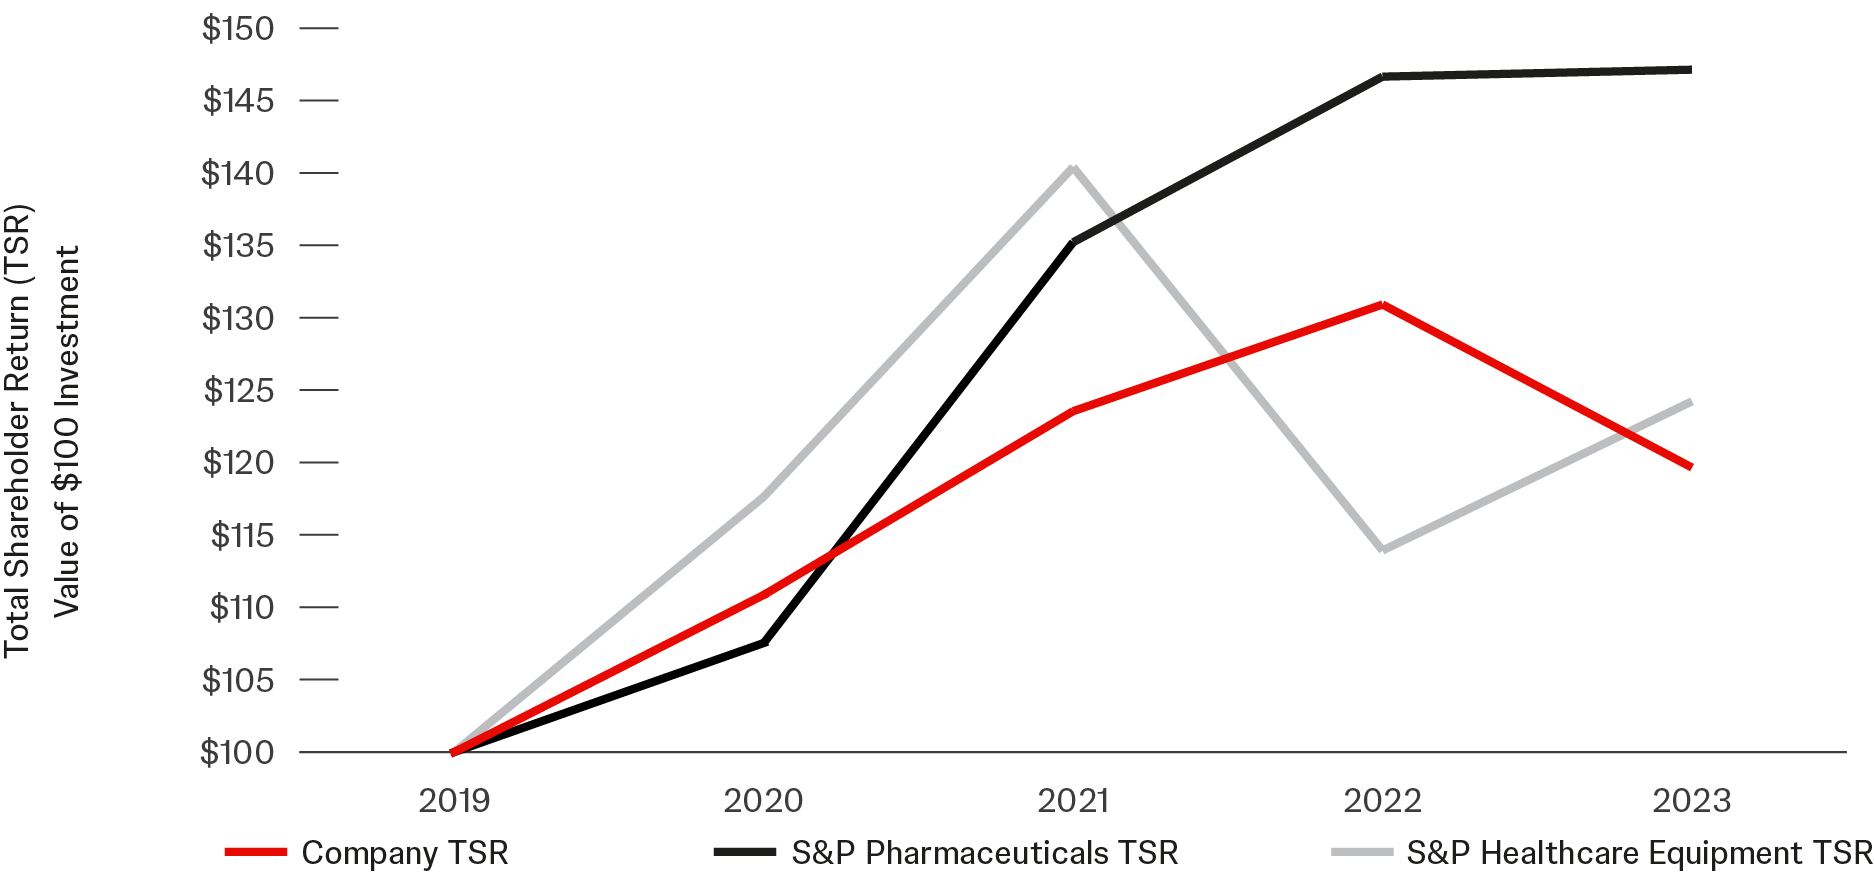
In this context, the Audit Committee has met and held discussions with management and the internal and independent auditors (including private sessions with the Vice President, Internal Audit, the independent auditor, the Chief Financial Officer, and the General Counsel at each Audit Committee meeting). Management represented to the Audit Committee that the company’s consolidated financial statements as of and for the fiscal year ended December 31, 2017 were prepared in accordance with generally accepted accounting principles, and the Audit Committee has reviewed and discussed the consolidated financial statements with management and the independent auditor. | | | | | | | 2024 Proxy Statement | 121 | | The Audit Committee has discussed with the independent auditor matters required to be discussed by the applicable Auditing Standards as periodically amended (including significant accounting policies, alternative accounting treatments and estimates, judgments and uncertainties). In addition, the Audit Committee has received the written disclosures and the letter from the independent auditor required by the applicable requirements of the Public Company Accounting Oversight Board regarding the independent auditor’s communications with the Audit Committee concerning independence, and the Audit Committee and the independent auditor have discussed the auditor’s independence from the company and its management, including the matters in those written disclosures. Additionally, the Audit Committee considered the non-audit services provided by the independent auditor and the fees and costs billed and expected to be billed by the independent auditor for those services (as shown on page 87 of this Proxy Statement). All of the non-audit services provided by the independent auditor since February 10, 2003, and the fees and costs incurred in connection with those services, have been pre-approved by the Audit Committee in accordance with the Audit and Non-Audit Services Pre-Approval Policy, as adopted by the Audit Committee. (This policy is discussed in further detail on page 88 of this Proxy Statement.) When approving the retention of the independent auditor for these non-audit services, the Audit Committee has considered whether the retention of the independent auditor to provide those services is compatible with maintaining auditor independence. |
In reliance on the reviews and discussions with management and the independent auditor referred to above, the Audit Committee believes that the non-audit services provided by the independent auditor are compatible with, and did not impair, auditor independence.The Audit Committee also has discussed with the company’s internal and independent auditors, with and without management present, their evaluations of the company’s internal accounting controls and the overall quality of the company’s financial reporting.
In further reliance on the reviews and discussions with management and the independent auditor referred to above, the Audit Committee recommended to the Board of Directors on February 21, 2018, and the Board has approved, the inclusion of the audited financial statements in the company’s Annual Report on Form 10-K for the fiscal year ended December 31, 2017,
|
Audit matters Audit Committee report The Audit Committee reports to and acts on behalf of the Board of Directors of the Company by providing oversight of the financial management, internal auditors, independent auditor, financial reporting controls and accounting policies and procedures of the Company. The Company's management is responsible for preparing the Company's financial statements and systems of internal control, and the independent auditor is responsible for auditing those financial statements and expressing its opinion as to whether the financial statements present fairly, in all material respects, the financial position, results of operations and cash flows of the Company in conformity with generally accepted accounting principles. The Audit Committee is responsible for overseeing the conduct of these activities by the Company's management and the independent auditor. In this context, the Audit Committee has met and held discussions with management and the internal and independent auditors (including private sessions with the Chief Audit Executive, the independent auditor, the Chief Financial Officer and the General Counsel at each quarterly Audit Committee meeting). Management represented to the Audit Committee that the Company’s consolidated financial statements as of and for the fiscal year ended December 31, 2023, were prepared in accordance with generally accepted accounting principles, and the Audit Committee has reviewed and discussed the consolidated financial statements with management and the independent auditor. The Audit Committee has discussed with the independent auditor matters required to be discussed by the applicable requirements of the Public Company Accounting Oversight Board (PCAOB) and the SEC including significant accounting policies, alternative accounting treatments and estimates, judgments and uncertainties, and critical audit matters. In addition, the Audit Committee has received the written disclosures and the letter from the independent auditor required by the applicable requirements of the PCAOB regarding the independent auditor’s communications with the Audit Committee concerning independence, and the Audit Committee and the independent auditor have discussed the auditor’s independence from the Company and its management, including the matters in those written disclosures. Additionally, the Audit Committee considered the non-audit services provided by the independent auditor and the fees and costs billed and expected to be billed by the independent auditor for those services as shown on page 124 of this Proxy Statement. All of the non-audit services provided by the independent auditor since February 10, 2003, and the fees and costs incurred in connection with those services, have been pre-approved by the Audit Committee in accordance with the Audit and Non-Audit Services Pre-Approval Policy, as adopted by the Audit Committee. This policy is discussed in further detail on page 125 of this Proxy Statement. When approving the retention of the independent auditor for these non-audit services, the Audit Committee has considered whether the retention of the independent auditor to provide those services is compatible with maintaining auditor independence. In reliance on the reviews and discussions with management and the Company's independent auditor, the Audit Committee believes that the non-audit services provided by the independent auditor are compatible with, and did not impair, auditor independence. The Audit Committee also has discussed with the Company's internal and independent auditors, with and without management present, their evaluations of the Company's internal accounting controls and the overall quality of the Company's financial reporting. In further reliance on the reviews and discussions with management and the Company's independent auditor, the Audit Committee recommended to the Board of Directors on February 12, 2024, and the Board has approved, the inclusion of the audited financial statements in the Company’s Annual Report on Form 10-K for the fiscal year ended December 31, 2023, for filing with the Securities and Exchange Commission. | | | | | | | D. ScottS. Davis, Chairman Ian E. L. DavisD. Adamczyk
AnneM. A. Hewson
A. M. Mulcahy William D. PerezM. A. Weinberger
|
| | | | 2018 Proxy Statement - 86
| | |
Item 3. | | | | | | | | | | | | | | | | 3 | Ratification of Appointmentappointment of Independent Registered Public Accounting Firmindependent registered public accounting firm | | | | | | | | | | | | | The Audit Committee oversees the qualifications, independence and performance of the independent auditor and has the ultimate responsibility to appoint, retain, compensate, evaluate and, when appropriate, terminate the independent auditor. The Audit Committee of the Board is directly responsible for the appointment, compensation, retention and oversight of the independent registered public accounting firm retained to audit the Company’s financial statements. The Audit Committee has appointed PricewaterhouseCoopers LLP as the independent registered public accounting firm for the Company and its subsidiaries for the fiscal year 2024. Shareholder ratification of the appointment is not required under the laws of the State of New Jersey but, as a matter of good corporate governance, the Board has decided to ascertain the position of the shareholders on the appointment at the Annual Meeting. The affirmative vote of a majority of the votes cast at the Annual Meeting is required for ratification. The Audit Committee will reconsider the appointment if it is not ratified. | | | | | The Audit Committee oversees the qualifications,
independence and performance of the independent
auditor and has the ultimate responsibility to
appoint, retain, compensate, evaluate and, when
appropriate, terminate the independent auditor.
| The Audit Committee of the Board of Directors is directly responsible for the appointment, compensation, retention and oversight of the independent registered public accounting firm retained to audit the company’s financial statements. The Audit Committee has appointed PricewaterhouseCoopers LLP as the independent registered public accounting firm for the company and its subsidiaries for the fiscal year 2018. Shareholder ratification of the appointment is not required under the laws of the State of New Jersey, but as a matter of good corporate governance, the Board has decided to ascertain the position of the shareholders on the appointment at the Annual Meeting. The affirmative vote of a majority of the votes cast at the meeting is required for ratification. The Audit Committee will reconsider the appointment if it is not ratified.
During fiscal years 2017 and 2016, PricewaterhouseCoopers LLP not only acted as the independent registered public accounting firm for the companyDuring fiscal years 2023 and 2022, PricewaterhouseCoopers LLP not only acted as the independent registered public accounting firm for the Company and its subsidiaries (work related to the integrated audit of our consolidated financial statements and internal control over financial reporting), but also rendered other services on behalf of the company and its subsidiaries.
Rules enacted under the Sarbanes-Oxley Act prohibit an independent auditor from providing certain non-audit services for an audit client. PricewaterhouseCoopers LLP has provided services in accordance with applicable rules and regulations. It is expected that PricewaterhouseCoopers LLP will continue to provide certain accounting, additional audit, tax and other services to the company and its subsidiaries, which are permitted under applicable rules and regulations.
PricewaterhouseCoopers LLP and its predecessors have served as Johnson & Johnson's independent auditor since at least 1920. The Audit Committee believes that this long tenure results in higher quality audit work and greater operational efficiencies by leveraging PricewaterhouseCoopers LLP's deep institutional knowledge of Johnson & Johnson's global operations and businesses, accounting policies and practices, and internal controls. In order to ensure continuing auditor independence, the Audit Committee periodically considers whether there should be a regular rotation of the company’s independent registered public accounting firm. In addition, in conjunction with the mandated rotation of the audit firm’s lead engagement partner every five years, the Audit Committee and its chairperson are directly involved in the selection of PricewaterhouseCoopers LLP’s new lead engagement partner.
The members of the Audit Committee and the Board believe that the continued retention of PricewaterhouseCoopers LLP to serve as the company’s independent registered public accounting firm is in the best interests of the company and its shareholders.
The Audit Committee is responsible for the audit fee negotiations associated with the retention of PricewaterhouseCoopers LLP. The table below sets forth the aggregate fees billed or expected to be billed by PricewaterhouseCoopers LLP for 2017 and 2016 for audit and non-audit services (as well as all “out-of-pocket” costs incurred in connection with these services) and are categorized as Audit Fees, Audit-Related Fees, Tax Fees and All Other Fees. The nature of the services provided in each such category is described following the table.
| |
| | | | Actual Fees (1) | 2017 | 2016 | | Audit Fees | $42,560 | $36,700 | | Audit-Related Fees | 25,560 | 22,915 | | Total Audit and Audit-Related Fees | 68,120 | 59,615 | | Tax Fees | 3,080 | 3,435 | | All Other Fees | 60 | 132 | | Total Fees | $71,260 | $63,182 | (1) Dollars in thousands
| | |
| | | | | | 2018 Proxy Statement - 87
|
Audit Fees – Consists of professional services rendered for the audit of our consolidated financial statements quarterly reviews, statutory audits, issuance of comfort letters and consents and assistance with, and review of, documents filed with the SEC.
Audit-Related Fees – Consists of assurance and related services related to employee benefit plan audits, due diligence related to mergers and acquisitions, accounting consultation and audits in connection with acquisitions and dispositions, system pre-implementation reviews, internal control reviews, attestover financial reporting), but also rendered other services on behalf of the Company and its subsidiaries.
Rules enacted under the Sarbanes-Oxley Act prohibit an independent auditor from providing certain non-audit services for an audit client. PricewaterhouseCoopers LLP has provided services in accordance with applicable rules and regulations. It is expected that are not required by statute or regulation, advice asPricewaterhouseCoopers LLP will continue to provide certain accounting, additional audit, tax and other services to the preparation of statutory financial statements,Company and consultations concerning financial accountingits subsidiaries, which are permitted under applicable rules and reporting standards.regulations. | | | | | | | | Tax Fees– Consists of tax compliance (review and preparation of corporate and expatriate tax returns, assistance with tax audits, review of the tax treatments for certain expenses, and transfer pricing documentation for compliance purposes relating to acquisitions), state and local tax planning, and consultations with respect to various domestic and international tax matters. All Other Fees – Consists of fees not included in the Audit, Audit-Related or Tax categories and includes reviews for compliance with various government regulations relating to the healthcare industry and privacy standards, supply chain operational reviews and risk management reviews and assessments.
Pre-Approval of Audit and Non-Audit Services
Under the Audit and Non-Audit Services Pre-Approval Policy, as adopted by the Audit Committee in 2003, the Audit Committee must pre-approve all audit and non-audit services provided by the independent auditor. The Policy, as described below, sets forth the procedures and conditions for such pre-approval of services to be performed by the independent auditor. The Policy utilizes both a framework of general pre-approval for certain specified services and specific pre-approval for all other services.
Each year, the Audit Committee is asked to pre-approve the engagement of the independent auditor, and the projected fees, for audit services, audit-related services (assurance and related services that are reasonably related to the performance of the auditor’s review of the financial statements or that are traditionally performed by the independent auditor) and tax services (such as tax compliance, tax planning and tax advice) for the current year. In addition, the following specific routine and recurring other services also may be pre-approved generally for the current year: audits or reviews of third parties to assess compliance with contracts; risk management reviews and assessments; healthcare compliance reviews; and other regulatory matters and certain projects to evaluate systems security.
The fee amounts approved at such meeting are updated to the extent necessary at the regularly scheduled meetings of the Audit Committee during the year. Additional pre-approval is required if actual fees for any service exceed the originally pre-approved amount by 5%, excluding the impact of currency.
If we want to engage the independent auditor for other services that are not considered subject to general pre-approval as described above, then the Audit Committee must approve such specific engagement, as well as the projected fees. Additional pre-approval is required before any fees can exceed those fees approved for any such specifically-approved services.
If we wish to engage the independent auditor for additional services that have not been generally pre-approved as described above, then such engagement will be presented to the Audit Committee for pre-approval at its next regularly scheduled meeting. If the timing of the project requires an expedited decision, then we may ask the Chairman of the Audit Committee to pre-approve such engagement. Any such pre-approval by the Chairman is then reported to the other Committee members at the next Committee meeting. In any event, pre-approval of any engagement by the Audit Committee or the Chairman of the Audit Committee is required before the independent auditor may commence any engagement.
In 2017, there were no fees paid to PricewaterhouseCoopers under a de minimis exception to the rules that waives pre-approval for certain non-audit services.
Representatives of PricewaterhouseCoopers are expected to be present at the Annual Meeting of Shareholders and will be allowed to make a statement if they wish. Additionally, they will be available to respond to appropriate questions from shareholders during the meeting.
| The Board of Directors recommends that shareholders vote FOR ratification of the appointment of PricewaterhouseCoopers LLP as our independent registered public accounting firm for fiscal 2018.
2024.
| | | | | | | | | | | |
| | | | 2018 Proxy Statement - 88
| | |
Selection and engagement of audit firm PricewaterhouseCoopers LLP and its predecessors have served as Johnson & Johnson's independent auditor since at least 1920. The Audit Committee believes that this long tenure results in higher quality audit work and greater operational efficiencies by leveraging PricewaterhouseCoopers LLP's deep institutional knowledge of our global operations and businesses, accounting policies and practices, and internal controls. In order to ensure continuing auditor independence, the Audit Committee periodically considers whether there should be a regular rotation of our independent registered public accounting firm. In addition, in conjunction with the mandated rotation of the audit firm’s lead engagement partner every five years, the Audit Committee and its Chairman were directly involved in the selection of PricewaterhouseCoopers LLP’s new lead engagement partner. The members of the Audit Committee and the Board believe that the continued retention of PricewaterhouseCoopers LLP to serve as our independent registered public accounting firm is in the best interests of our Company and our shareholders. Audit and non-audit fees The Audit Committee is responsible for the audit fee negotiations associated with the retention of PricewaterhouseCoopers LLP. The table below sets forth the aggregate fees billed or expected to be billed by PricewaterhouseCoopers LLP for 2023 and 2022 for audit and non-audit services (as well as all out-of-pocket costs incurred in connection with these services) and are categorized as Audit Fees, Audit-Related Fees, Tax Fees and All Other Fees. The nature of the services provided in each such category is described in the following table. | | | | | | | | | | Actual fees (dollars in thousands) | 2023 | 2022 | | Audit fees | $38,675 | $43,995 | | Audit-related fees | 15,745 | 32,620 | | Total audit and audit-related fees | 54,420 | 76,615 | | Tax fees | 1,900 | 1,100 | | All other fees | 1,090 | 1,580 | | Total fees | $57,410 | $79,295 |
Audit fees. Consists of professional services rendered for the audit of our consolidated financial statements, quarterly reviews, statutory audits, issuance of comfort letters and consents, and assistance with, and review of, documents filed with the SEC. Audit-related fees. Consists of assurance and related services related to employee benefit plan audits, due diligence related to mergers and acquisitions, accounting consultation and audits in connection with acquisitions and dispositions including the Consumer Health separation, system pre-implementation reviews, internal control reviews, attest services that are not required by statute or regulation, advice as to the preparation of statutory financial statements, consultations concerning financial accounting and reporting standards and other audit-related costs. Tax fees. Consists of tax compliance (review and preparation of U.S. corporate and international tax returns, assistance with tax audits, review of the tax treatments for certain expenses and transfer-pricing documentation for compliance purposes), state and local tax planning, and consultations with respect to various domestic and international tax matters. All other fees. Consists of fees not included in the Audit, Audit-Related or Tax categories and includes accounting research software, benchmarking, assurance on non-financial metrics, market assessments, system and organization controls reports and other operational reviews.
Pre-approval of audit and non-audit services Under the Audit and Non-Audit Services Pre-Approval Policy, as adopted by the Audit Committee in 2003, the Audit Committee must pre-approve all audit and non-audit services provided by the independent auditor. The Policy, as described below, sets forth the procedures and conditions for such pre-approval of services to be performed by the independent auditor. The Policy utilizes both a framework of general pre-approval for certain specified services and specific pre-approval for all other services. Each year, the Audit Committee is asked to pre-approve the engagement of the independent auditor and the projected fees for audit services, audit-related services (assurance and related services that are reasonably related to the performance of the auditor’s review of the financial statements or that are traditionally performed by the independent auditor) and tax services (such as tax compliance, tax planning and tax advice) for the current year. In addition, the following specific routine and recurring other services also may be pre-approved generally for the current year, audits or reviews of third parties to assess compliance with contracts, assurance on non-financial metrics, and system and organization controls reports. The fee amounts approved annually are updated to the extent necessary at the regularly scheduled meetings of the Audit Committee during the year. Additional pre-approval is required if actual fees for any service exceed the originally pre-approved amount by 5%, excluding the impact of currency translation. If we want to engage the independent auditor for other services that are not considered subject to general pre-approval as described above, then the Audit Committee must approve such specific engagement as well as the projected fees. Additional pre-approval is required before any fees can exceed the fees approved for the specifically approved services. If we wish to engage the independent auditor for additional services that have not been generally pre-approved as described above, then such engagement will be presented to the Audit Committee for pre-approval at its next regularly scheduled meeting. If the timing of the project requires an expedited decision, then we may ask the Chairman of the Audit Committee to pre-approve the engagement. Any such pre-approval by the Chairman is then reported to the other Committee members at the next Committee meeting. In any event, pre-approval of any engagement by the Audit Committee or the Chairman of the Audit Committee is required before the independent auditor may commence any engagement. In 2023, there were no fees paid to PricewaterhouseCoopers LLP under a de minimis exception to the rules that waives pre-approval for certain non-audit services. Representatives of PricewaterhouseCoopers LLP are expected to be present at the Annual Meeting of Shareholders and will be allowed to make a statement if they wish. Additionally, they will be available to respond to appropriate questions from shareholders during the Annual Meeting.
| | | | | | | | | | | | | | | | 4 | Shareholder Proposal – Accounting for Litigationproposal ― gender-based compensation gaps and Compliance In Executive Compensation Performance Measuresassociated risks | | | | | | | | | | | | | The following shareholder proposal has been submitted to the companyCompany for action at the meetingAnnual Meeting by The City of Philadelphia Public Employees Retirement System, Two Pennthe National Legal and Policy Center, Plaza, 16th Floor, Philadelphia, PA 19102-1712, a107 Park Washington Court, Falls Church, Virginia 22046, beneficial owner of in excess of $2,000 worth of27 shares of the company’sCompany’s common stock. The affirmative vote of a majority of the shares voted at the meetingAnnual Meeting is required for approval of the shareholder proposal. The text of the proposal follows:follows. RESOLVEDWHEREAS: Compensation and benefits inequities persist across employee gender categories, and pose substantial risk to companies and society at large.
The United States Department of Labor states that shareholders"equal pay" is required if persons of different genders "perform equal work in the same workplace," and that "all forms of compensation are covered, meaning not only pay, but also benefits."1 The U.S. Equal Employment Opportunity Commission adds:2 It is illegal for an employer to discriminate against an employee in the payment of wages or employee benefits on the bases of race, color, religion, sex (including gender identity, sexual orientation, and pregnancy), national origin, age (40 or older), disability or genetic information. Employee benefits include sick and vacation leave, insurance, access to overtime as well as overtime pay, and retirement programs. Supporting Statement: Johnson & Johnson ("JNJ"Company") urgeprovides health benefits to employees who suffer gender dysphoria/confusion, and who seek medical, chemical, and/or surgical treatments, offering "coverage for surgery to change the Board of Directors to adopt a policy that no financial performance metric shall be adjusted to exclude Legal or Compliance Costs when evaluating performance for purposes of determining the amount or vestingsex of any senior executive Compensation award. "Legalemployee diagnosed with gender identity disorder."3 The Company boasts about its 100 percent score on the Human Rights Campaign's Corporate Equality Index ("CEI") and HRC's designation as a "Best Places to Work for LGBTQ+ Equality."4 Company policy affirms it is possible for dysphoria sufferers to transition to a different sex. Yet an increasing body of scientific evidence shows no benefits result from such treatments.5 In the United States and Europe, the medical community is increasingly cautious about transitioning therapies and surgeries.6 7 Victims report transition treatments and surgeries and harmful. Examples include long-lasting or Compliance Costs"permanent outcomes like chronic pain, sexual dysfunction, unwanted hair loss or hair gain, menstrual irregularities, urinary problems, and other complications.8 Rather than resolve health problems, "gender affirming" therapies often exacerbate them.9 In such instances, those who desire to "detransition" cannot find medical care or insurance coverage, and are expensespermanently mutilated.10 Many of these sufferers litigate against those who misled or chargesharmed them.11 12 HRC contemplates no accommodations for detransitioners or restorative health care for such individuals ― instead, it denies there is need for such care.13 Hence, the CEI-perfect Company appears to offer no such insurance coverage in its employee benefits ― only for so-called "gender-affirming care," which includes a medical travel benefit.14 Detransitioners are protected under "gender identity" and "sexual orientation" EEOC categories and therefore cannot be discriminated against. RESOLVED: Shareholders request the board of directors issue a report by March 31, 2025 about compensation and health benefit gaps, which should include how they address dysphoria and detransitioning care across gender classifications, including associated with any investigation, litigation or enforcement actionreputational, competitive, operational and litigative risks, and risks related to drug manufacturing, sales, marketing or distribution, including legal fees; amounts paid in fines, penalties or damages;recruiting and amounts paid in connection with monitoring required by any settlement or judgment of claims of the kind described above. "Incentive Compensation" is compensation paid pursuant to short-term and long-term incentive compensation plans and programs.retaining diverse talent. The policyreport should be implemented in a way that does not violate any existing contractual obligation of the Company or the terms of any compensation or benefit plan. SUPPORTING STATEMENT
As JNJ shareholders, we support compensation arrangements that incentivize senior executives to drive growth while safeguarding company operationsprepared at reasonable cost, omitting proprietary and reputation over the long-term. JNJ adjusts certain financial metrics when calculating progressprivate information, litigation strategy and legal compliance information, and should be published on goals for the purposes of awarding incentive compensation. While some adjustments may be appropriate, we believe senior executives should not be insulated from legal risks, particularly on matters of import.
President Trump has recently declared the opioid epidemic a public health emergency. According to pages 79-80 of the Company's 2017 10-K, JNJ has been namedwebsite.
1https://www.employer.gov/EmploymentIssues/pay-and-benefits/Equal-pay/ 2https://www.eeoc.gov/prohibited-employment-policiespractices 3https://www.careers.jnj.com/careers/what-makes-johnson-johnson-a-global-leader-in-diversity-inclusion. 4https:/belong.jnj.com/2022/ 5https://www.foxnews.com/politics/crenshaw-grills-dem-witness-failure-name-one-study-citing-benefits-surgeries-trans-kids 6https://www.wsj.com/articles/second-thoughts-on-gender-affirming-care-american-academy-pediatrics-doctors-review-medicine-a7173276 7https://www.wsj.com/articles/u-s-becomes-transgender-care-outlier-as-more-in-europe-urge-caution-6c70b5e0 8https://www.dailymail.co.uk/health/article-11629421/Half-trans-surgery-patients-suffer-extreme-pain-sexual-issues-years-later.html 9https://www.dailymail.co.uk/femail/article-12250695/I-trans-surgery-woman-19-four-years-later-Im-man.html 10https://thefederalist.com/2023/02/10/detransitioners-are-being-abandoned-by-medical-professionals-who-devastated-their-bodies-and-minds/ 11https://public.substack.com/p/why-this-detransitioner-is-suing. 12https://www.dailymail.co.uk/news/article-12310887/Young-North-Carolina-woman-sues-doctors-testosterone-age-17-saying-needed-therapy-not-double-mastectomy-latest-blockbuster-detransition-lawsuit.html 13https://www.hrc.org/resources/myths-and-facts-battling-disinformation-about-transgender-rights 14https://www.jnj.com/innovation/employee-benefits-that-help-make-johnson-johnson-a-great-company | | | | | | |
| | | | | | | | | | | | | | | | | | | | | | Board's statement in several lawsuits relatingopposition to the marketing of opioid pharmaceuticals and has been subpoenaed by other states for similar claims. Attorneys general of 41 states have opened an investigation of opioid makers and distributors that includes JNJ's subsidiary Janssen Pharmaceuticals.We believe the opioid emergency presents a heightened level of risk for JNJ investors. We also believe JNJ is well positioned to incentivize senior executives to mitigate these risks by ensuring their compensation is tied to effective management of this crisis. As it is structured now, JNJ may insulate senior executives from legal risks by removing associated costs from the metrics that determine their incentive compensation.
JNJ uses adjusted earnings per share ("EPS") and adjusted operational EPS for incentive compensation according to page 42 of the 2017 proxy statement. The adjusted figures are non-GAAP financial measures whose calculations may exclude litigation.
We believe a superior approach to measuring EPS and operational EPS is to include Legal and Compliance Costs, particularly those associated with opioid litigation.
We urge shareholders to vote for this proposal.
shareholder proposal | | | | | | | | 2018 Proxy Statement - 89
|
Board’s Statement in Opposition to Shareholder Proposal
The Board of Directors recommends a vote AGAINST the adoption of this proposal for the following reasons: | | | | | | | | Johnson & Johnson has long been a leader in employee benefits programs, which remain among the best in our industry.
For 75 years, Johnson & Johnson has been guided by oura leader in employee benefits and support for more than a century. Since its founding in 1886, and consistent with Our Credo, in every aspectJohnson & Johnson has built a legacy of caring for employees, whether it is advocating for better wages during the Great Depression, making childcare easier for employees or supporting employee military service members.
That commitment to support of our business, includingemployees continues today and is reflected in determiningour employee benefits, which remain among the best in our industry. As part of our total rewards philosophy, we offer competitive compensation and benefits to attract and retain top talent. We are committed to fairness and equitable treatment in our compensation and benefits for employees at all levels, and this commitment is evident in the benefit plans we provide to our employees and executives. We design our executive compensation programs to attract, develop and retain effective global business leaders who demonstrate both strong performance and Credo values to build long term value for our shareholders. their families. The performance of each executive is measured againstproposal does not identify a set of financial and strategic goals for the Company, as well as financial and strategic goals alignedgap in coverage with respect to the executive’s business sector or function. These goals ensure that our leaders considerCompany’s benefits and the purported risk is not only their individual results, but also the ways they can contributerelevant to the long-term valueCompany’s operations. The proposal seeks a report addressing alleged compensation and health benefit gaps, including with respect to gender dysphoria and detransitioning care, but fails to identify any such gaps. To the contrary, our benefits programs do not draw distinctions on the basis of Johnson & Johnson. In addition,gender or other protected characteristics and do not exclude de-transitioning care. Further, we evaluate the decisionsroutinely poll our employees with respect to our benefits offerings; we receive consistently positive feedback, and behavior of each executive to ensure thatthis issue has not been identified as a potential concern within our executives are leading in a manner that is consistent with the values embodiedemployee base. The purported risks outlined in the Credo. We believe that by considering individual results, Company performancesupporting statement are theoretical and Credo values, our incentive compensation programs are appropriately designednot relevant to align the interests of our senior executives with the long-term interests of our shareholders. As a healthcare market leader with a broad range of products and a deep commitment to research and development, we make product quality and compliant marketing and commercial practices our top business priority. We carefully consider these core Credo values when evaluating executive performance. In the ordinary course of business, the Company and its subsidiaries are subject to claims and lawsuits involving various issues, and we are committed to ensuring and defending the safety and quality of our products. We have strong internal compliance programs and rigorous, independent quality and safety review processes, all designed to ensure compliant business practices and high quality products. These programs and processes, which support our core Credo values, help mitigate compliance risk and litigation exposure.
While we have sincere sympathy for individuals and families facing medical and health conditions and deep respect for the legal process, the litigation landscape is complex and driven by a number of external factors. In connection with the concerns about opioids, we have always been committed to ensuring our medicines are used correctly. We provide important information about their risks and benefits on every product label, and we’ve established educational programs intended to result in healthier patients and reduced rates of abuse and addiction. Janssen pain medicines were designed to prevent and deter abuse, and our medicines have someoperations of the lowest rates of abuse among prescription opioid pain medications. In fact, Janssen no longer develops or promotes opioid-based pain medicines and since 2008, the volume of our prescription opioids always has amounted to less than one percent of the total prescriptions written per year for opioid medications in the U.S. Responsibly used opioid-based pain medications play a critical role in helping doctors and patients manage the debilitating effects of serious pain.Company.
In consideration of this complexity, we believe that our approach to incentive compensation for our senior executives, which considers individual results, Company performance and the values set forth in the Credo, is an appropriate way to align the interests of our senior executives with the long-term interest of our shareholders. Further, we believe that it is essential that the Board maintain flexibility to assess whether or not legal and compliance costs should impact the compensation of specific executives.
It is, therefore, recommended that shareholders vote AGAINST this proposal.
| | | | | | |
| | | | 2018 Proxy Statement - 90
| | |
| | | | | | | | | | | | | | | | 5 | Item 5: Shareholder Proposal – Amendment to Shareholder Ability to Call Special Shareholder Meetingproposal ― impact of extended patent exclusivities on patient access
| | | | | | | | | | | | | The following shareholder proposal has been submitted to the companyCompany for action at the meetingAnnual Meeting by William Steiner,Mercy Investment Services, Inc., c/o Komlossy Law, PA, 4700 SheridanLydia Kuykendall, Director of Shareholder Advocacy, 2039 North Geyer Road, St. Suite J, Hollywood, FL 33021, aLouis, MO 63131, beneficial owner of no less than 100at least $2,000 worth of shares of the company’sCompany’s common stock. The affirmative vote of a majority of the shares voted at the meetingAnnual Meeting is required for approval of the shareholder proposal. The text of the proposal follows:
Proposal 5 - Shareholder Ability to Call Special Shareholder Meeting
Resolved, Shareowners ask our board to take the steps necessary (unilaterally if possible) to amend our bylaws and each appropriate governing document to give holders in the aggregate of 10% of our outstanding common stock the power to call a special shareowner meeting (or the closest percentage to 10% according to state law). In other words this proposal asks for adoption of the most shareholder-friendly version of the shareholder right to call a special meeting as permitted by state law. This proposal does not impact our board's current power to call a special meeting.
This proposal topic won more than 70%-support at Edwards Lifesciences and SunEdison in 2013. A shareholder right to call a special meeting and to act by written consent and are 2 complimentary ways to bring an important matter to the attention of both management and shareholders outside the annual meeting cycle such as the election of directors.
RESOLVED, that Johnson & Johnson ("JNJ") shareholders do not have the full right to call a special meeting that is available under state law. If shareholders had a more complete right to call a special meeting, as called for in this proposal, shareholders would have a greater ability to engage our Board to improve the qualifications of our directors and make sure thatask the Board of Directors to establish and report on a process by which the impact of extended patent exclusivities on product access would be considered in deciding whether to apply for secondary and tertiary patents. Secondary and tertiary patents are patents applied for after the main active ingredient/molecule patent(s) and which relate to the product. The report on the process should be prepared at reasonable cost, omitting confidential and proprietary information, and be made public.
SUPPORTING STATEMENT: Intellectual property protections on branded drugs play an important role in maintaining high prices and impeding access. When patent protection on a drug ends, generic manufacturers can enter the market, reducing prices. But branded drug manufacturers may try to delay generic competition by extending their exclusivity periods. In part because of this behavior access to medicines is continually refreshed with new diverse talentthe subject of consistent and widespread public debate in orderthe U.S. A 2021 Rand Corporation analysis concluded that U.S. prices for branded drugs were nearly 3.5 times higher than prices in 32 OECD member countries.1 The Kaiser Family Foundation has "consistently found prescription drug costs to maintain director independence - since a special meetingbe an important health policy area of public interest and public concern."2 This high level of concern has driven policy responses. The Inflation Reduction Act empowers the federal government to negotiate some drug prices, and in fact some have argued it enacts significant patent reform, specifically around the issue this proposal seeks to understand. This comes from one important provision stating that the only drugs that can be calledconsidered for price negotiations are those with no generic competition, thus discouraging extended patent exclusivities. One law firm asserts that "prevailing in regarda patent infringement lawsuit against a forthcoming competitor may no longer be as valuable for a branded drug company because high-expenditure single-source drugs are at risk of being selected for price negotiation if there is no generic or biosimilar competitor on the market."3 Additionally, there are 5 U.S. Senate bipartisan bills all aimed at addressing this issue: 1.Ensuring Timely Access to the electionGenerics Act of directors.2023 (S. 1067) Please vote2.Expanding Access to improve the shareholder oversightLow-Cost Generics Act of 2023 (S. 1114)
3.Increasing Transparency in Generic Drug Applications Act of 2023 (S. 775) 4.Preserve Access to Affordable Generics and Biosimilars Act of 2023 (S. 142) 5.Stop STALLING Act of 2023 (S. 148) Specifically, JNJ sells Remicade, a biologic drug that treats inflammatory disorders. Although biosimilar competitors have now launched,4 Remicade has been cited as an example of a patent thicket, with over 100 patents.5 With AbbVie, JNJ jointly markets cancer treatment Imbruvica, which had 165 patent applications and 88 granted patents as of July 2020.6 In our company:view, recent policy changes and reputational hits around bedaquiline availability7 shows that a more thoughtful process could bolster JNJ's reputation and help avoid regulatory blowback resulting from high drug prices and perceptions regarding abusive patenting practices. Shareholder Ability to Call Special Shareholder Meeting - Proposal 51https://www.rand.org/news/press/2021/01/28.html
2https://www.kff.org/health-costs/poll-finding/public-opinion-on-prescription-drugs-and-their-prices/
3https://www.akingump.com/en/insights/alerts/the-impact-of-the-inflation-reduction-act-of-2022-on-pharmaceutical-innovation-patent-litigation-and-market-entry
4See https://www.sec.gov/ix?doc=/Archives/edgar/data/0000200406/000020040622000022/jnj-20220102.htm, at 25. 5See https://www.bloomberg.com/news/articles/2017-09-07/this-shield-of-patents-protects-the-world-s-best-selling-drug 6http://www.i-mak.org/wp-content/uploads/2020/08/I-MAK-Imbruvica-Patent-Wall-2020-07-42F.pdf 7https://msfaccess.org/msf-calls-commitment-pharma-corporation-jj-not-enforce-extended-patents-lifesaving-tb-drug-main | | | | | | |
| | | | | | 2018 Proxy Statement - 91
|
Board’s Statement | | | | | | | | | | | | | | | | | | | | | | Board's statement in Oppositionopposition to Shareholder Proposalshareholder proposal | | | The Board of Directors recommends a vote AGAINST the adoption of this proposal for the following reasons: | | | | | | | | Johnson & Johnson uses patents to enable continued innovation in support of patient access and choice.
UnderEach year, Johnson & Johnson invests billions of dollars in research and development to address the unmet health and medical needs of patients around the world, resulting in new innovation whose protection is critical to funding the next generation of innovation. In 2023, the Company invested approximately $15.1 billion in research and development. Patent protection helps promote innovation, access and affordability, and is critical to fulfilling our by-laws, shareholders representing 25%mission of changing the trajectory of health for humanity. Patent protection also provides a vital framework to help enable the development of innovative and life-changing treatments, cures and other healthcare technologies for patients and consumers around the world. Developing new medicines is an iterative process, involving continued progress that further benefits patients. Ongoing scientific advances and data gathered from product usage can foster “follow-on” innovations that make products better, safer or more useful, each of which can increase doctor and patient choice in available treatments and has the company’s outstanding shares havepotential to improve patient outcomes. Patent protection supports, encourages and incentivizes research and development of follow-on pharmaceutical innovations, provided these new innovations reach the rightrequisite criteria of being new, useful and non-obvious.
Johnson & Johnson has already demonstrated a strong commitment to requireexpanding patient access to its products. Johnson & Johnson recognizes that we callpatient access to pharmaceutical products is a special meeting. The Board believes this ownership threshold, coupled with other meaningful shareholder rightsvital issue to present director nomineesour customers, which is why access to medicine is integrated into our overall corporate strategy. This fact is reflected in Our Credo, which drives thoughtful consideration of patient access in our day-to-day decision making. Patient access, as the proposal asserts, comprises both affordability and accessibility to the products used to treat the myriad of illnesses facing the global population. Patent protection neither inflates prices nor reduces competition – it facilitates reinvestment in additional clinical trials and new drug development. Reinvestment and follow-on innovation often results in the company’s proxy materials (i.e., Proxy Access)discovery of new forms and uses of existing chemical compounds or substances better suited to act by written consent, strikes a reasonable and appropriate balance between empowering shareholders with an important right and minimizing the risk that a small group of shareholders, including those with special interests, could call special meetings. Allowing a handful of shareholders, including those who could borrow shares from other shareholders, to have the ability to call special meetings for any reason could be detrimental to the interest of the vast majority of our shareholders and other stakeholders.patient needs. In addition, under the New Jersey Business Corporation Act (NJBCA), which is applicable to our company, shareholders holding at least 10% of the company’s shares entitled to vote at a meeting of shareholders may apply to state court to order a special meeting upon a showing of good cause.
Given the company’s sizeCompany’s response to last year’s shareholder proposal, existing public disclosures, commitment to global health equity, and large number of shareholders, significant timeour responsible approach to drug pricing and expense is required to hold a special shareholder meeting, which requires the preparation, printing and distribution of disclosure documents, solicitation of proxies and tabulation of votes. These meetings also divert attention, time and resources from the Board’s and management’s focus on the business. We believe that our shareholders’ existing right to call a special meeting is meaningful and appropriate, allowing a relatively small percentage of outstanding shares to call a special meeting while providing reasonable safeguards against potential abuse or waste of corporate resources by a small handful of shareholders. | | In addition to the ability to call a special meeting, our company’s governance practices and policies provide many effective ways for shareholders to express their views and take action. As explained more fully above on page 23 under “Shareholder Engagement”, we actively engage with our shareholders throughout the year, including through meetings attended by our Board Chair and our Lead Director. This engagement positively impacts our governance, often resulting in concrete actions and changes in policy, including actions taken in 2017 (see page 24 “Shareholder Engagement.”) | In addition to significant shareholder engagement, our company has many other important governance features and shareholder rights (see page 27 “Additional Governance Features”). In particular, except with respect to the annual election of directors, our shareholders have the right to act by non-unanimous written consent in all instances where they otherwise have the right to act at a meeting of shareholders. |
Thus,access, the Board believes that thisthe proposal would not provide meaningful new information to shareholders, is not necessary and therefore would not be in the best interests of the companyCompany or its shareholders.
Despite this proposal receiving limited support in 2023, Johnson & Johnson increased its patent-related disclosures following the 2023 Annual Meeting of Shareholders.
Johnson & Johnson values feedback from our investors and continuously seeks opportunities to enhance our disclosures in ways that our stakeholders find valuable. Consistent with this philosophy, the Company provides information on its approach to intellectual property, including its use of patents, and the benefits to consumers, patients and governments as well as the healthcare industry in the Johnson & Johnson Position on intellectual property1. Additionally, each year, the Company publishes the U.S. Transparency Report2 the Transparency Report, which demonstrates the Company’s commitment to transparency and provides extensive disclosures on its responsible approach to pricing. This same proposal was presented at our Annual Meeting of Shareholders in 2023 and the Company has had numerous engagements with the proponents. At the 2023 meeting, this proposal received 14.4% support. Despite the voting returns, we added simplified disclosure in the form of a patent table3 for our major Innovative Medicine therapeutic products due to shareholder interest. Together, we believe our present disclosures address our investors’ interests and reflect our continued commitment to transparency. 1www.jnj.com/about-jnj/policies-and-positions/our-position-on-intellectual-property 2https://transparencyreport.janssen.com 3www.investor.jnj.com/files/pipeline-tables/us-patent-expiry-tables.pdf It is, therefore, recommended that shareholders vote AGAINST this proposal.
| | | | | | |
| | | | | |  This Proxy Statement is furnished in connection with the solicitation of proxies by the Board for the Annual Meeting of Shareholders. This Proxy Statement, proxy card and our 2023 Annual Report to shareholders are being distributed to our shareholders on or about March 13, 2024. 2018 Proxy Statement - 92
| | | | Shareholders entitled to vote and voting standard |
|
Shareholders of record of our common stock at the close of business on February 27, 2024, are entitled to notice of, and to vote at, our Annual Meeting and at any adjournments or postponements of the Annual Meeting. Each share of common stock entitles its owner to one vote. On February 27, 2024, there were 2,409,783,054 shares outstanding. To constitute a quorum, a majority of the shares entitled to vote must be represented in person or by proxy at the Annual Meeting. Approval of each voting item, including the election of Directors, requires the affirmative vote of a majority of the votes cast at the Annual Meeting. For purposes of determining the number of votes cast with respect to these matters, only those cast “For” or “Against” are included; abstentions and broker non-votes are counted only for purposes of determining whether a quorum is present at the Annual Meeting. You are encouraged to vote in advance of the Annual Meeting using one of the following voting methods. Make sure you have your Notice, proxy card or vote instruction form in hand and follow the instructions. Registered Shareholders: Shareholders who hold their shares directly with our stock registrar, Computershare, can vote any one of four ways: | | | | | | | | | Other Matters
The Board of Directors does not intend to bring other matters before the meeting except items incidentTo vote VIA THE INTERNET prior to the conductmeeting, go to the website listed on your proxy card or notice.
| | To vote BY PHONE, call the telephone number specified on your proxy card or on the website listed on your notice. | | If you vote via the internet or by telephone, your voting instructions may be transmitted up until 11:59 p.m. Eastern Time on April 24, 2024, except with respect to shares held in a Johnson & Johnson employee savings plan, which must be submitted by 5:00 p.m. Eastern Time on April 23, 2024. See Johnson & Johnson Employee Savings Plans on page 132 for voting instructions regarding shares held under our savings plans. | | If you received paper copies of your proxy materials, mark, sign, date and return your proxy card in the postage-paid envelope provided to vote BY MAIL. | | To vote DURING THE VIRTUAL MEETING, visit www.virtualshareholdermeeting.com/JNJ2024 and use your 16-digit control number. Whether or not you plan to attend the Annual Meeting, we urge you to vote and submit your proxy in advance of the meeting and we have not received timely noticeby using one of the methods described above. | | | | | Beneficial Shareholders: Shareholders who hold their shares beneficially through an institutional holder of record, such as a bank or broker (sometimes referred to as holding shares “in street name”), will receive voting instructions from any shareholderthat holder of an intentrecord. If you wish to present any other proposalvote in person at the meeting. On any matter properly brought beforeAnnual Meeting, you must obtain a legal proxy from the holder of record of your shares and present it at the Annual Meeting. |
| | | | Annual Meeting of Shareholders attendance | |
The 2024 Annual Meeting will be held online in a virtual format. Shareholders as of the record date may attend, vote and submit questions virtually at our Annual Meeting of Shareholders by logging in at www.proxyvote.com/JNJ. To log in, shareholders (or their authorized representatives) will need the 16-digit control number provided on your Notice, on your proxy card or in the voting instructions that accompanied your proxy materials. On the day of the meeting shareholders should log into www.virtualshareholdermeeting.com/JNJ2024. If you are unable to locate your 16-digit control number, please call Shareholder Meeting Registration Phone Support (toll free) at 844-983-0876 or (international toll call) at 303-562-9303, or email AnnualMeeting@its.jnj.com for assistance. The Board does not intend to bring other matters before the Annual Meeting except items incident to the conduct of the Annual Meeting, and we have not received timely notice from any shareholder of an intent to present any other proposal at the Annual Meeting. On any matter properly brought before the Annual Meeting by the Board or by others, the persons named as proxies in the accompanying proxy, or their substitutes, will vote in accordance with their best judgment.
We distribute proxy materials to many shareholders via the internet under the SEC’s “Notice and Access” rules to save costs and paper. Using this method of distribution, on or about March 13, 2024, we mailed the Important Notice Regarding the Availability of Proxy Materials (Notice) that contains basic information about our 2024 Annual Meeting and instructions on how to view all proxy materials and vote electronically via the internet. If you receive the Notice and prefer to receive the proxy materials by regular mail or e-mail, follow the instructions in the Notice for making this request and the materials will be sent promptly to you via the preferred method. If you prefer to vote by phone rather than internet, the website listed on the Notice (www.proxyvote.com/JNJ) has instructions for voting by phone. | | | | Proxy voting | | | | | | 2018 Proxy Statement - 93
|
General Information
This Proxy Statement is furnished in connection with the solicitation of proxies by our Board of Directors for the Annual Meeting of Shareholders. This Proxy Statement, proxy form and our 2017 Annual Report to Shareholders are being distributed to our shareholders on or about March 14, 2018.
| | | | | | | Shareholders Entitled
to Vote and Voting Standard
| Shareholders of record of our common stock at the close of business on February 27, 2018 are entitled to notice of, and to vote at, our Annual Meeting, and at any adjournments or postponements of the meeting. Each share of common stock entitles its owner to one vote. On February 27, 2018, there were 2,682,639,663 shares outstanding.
To constitute a quorum, a majority of the shares entitled to vote must be represented in person or by proxy at the Annual Meeting. Approval of each matter submitted to the shareholders, including the election of Directors, requires the affirmative vote of a majority of the votes cast at the meeting. For purposes of determining the number of votes cast with respect to a particular matter, only those cast “For” or “Against” are included; abstentions and broker non-votes are counted only for purposes of determining whether a quorum is present at the meeting.
| | | | How to Vote | You are encouraged to vote in advance of the meeting using one of the following voting methods, even if you are planning to attend the 2018 Annual Meeting of Shareholders.
Make sure you have your Notice, proxy card or vote instruction form in hand and follow the instructions.
| | | | Registered Shareholders: Shareholders who hold their shares directly with our stock registrar, Computershare, can vote any one of four ways:
| | | | | Via the Internet: Go to www.proxyvote.com/JNJ and follow the instructions on the website.
| | | | | By Telephone: Call (800) 690-6903 and follow the instructions given by the voice prompts.
| | | | | If you vote via the Internet or by telephone, your voting instructions may be transmitted up until 11:59 p.m. Eastern Time on April 25, 2018, except with respect to shares held in a Johnson & Johnson employee savings plan, which must be submitted by 5:00 p.m. Eastern Time on April 24, 2018. See “Johnson & Johnson Employee Savings Plans” on page 96 for voting instructions regarding shares held under our savings plans. | | | | | By Mail: If you received paper copies of the Proxy Statement, Annual Report and proxy card, mark, sign, date and return the proxy card in the postage-paid envelope provided.
| | | | | In Person: Attend the Annual Meeting, or send a personal representative with an appropriate proxy, to vote by ballot at the meeting. (See “Annual Meeting Information” and “Admission Ticket Procedures” on page 96. | | | | Beneficial Shareholders: Shareholders who hold their shares beneficially through an institutional holder of record such as a bank or broker (sometimes referred to as holding shares “in street name”), will receive voting instructions from that holder of record. If you wish to vote in person at the meeting, you must obtain a legal proxy from the holder of record of your shares and present it at the meeting.
|
| | | | 2018 Proxy Statement - 94
| | |
| | | | | Notice and Access | We distribute proxy materials to many shareholders via the Internet under the SEC’s “Notice and Access” rules to save costs and paper. Using this method of distribution, on or about March 14, 2018, we mailed the Important Notice Regarding the Availability of Proxy Materials (“Notice”) that contains basic information about our 2018 Annual Meeting and instructions on how to view all proxy materials, and vote electronically, via the Internet. If you receive the Notice and prefer to receive the proxy materials by regular mail or e-mail, follow the instructions in the Notice for making this request, and the materials will be sent promptly to you via the preferred method. If you prefer to vote by phone rather than Internet, the website listed on the Notice (www.proxyvote.com/JNJ) has instructions for voting by phone.
| | | Proxy Voting | Your proxy authorizes another person to vote your shares on your behalf at the Annual Meeting. If your valid proxy is timely received by internet, telephone or mail, the persons designated as proxies will vote your shares per your directions. We have designated two of our executive officers as proxies for the 2024 Annual Meeting of Shareholders: J. Wolk and E. Forminard. Should any other matter not referred to in this Proxy Statement properly come before the Annual Meeting, the designated proxies will vote in their discretion. If any Director nominee should refuse or be unable to serve due to an event that is not anticipated, your shares will be voted for the person designated by the Board to replace such nominee or, alternatively, the Board may reduce the number of Directors on the Board. | | | | Effect of not casting your vote | |
Proxies that are signed and returned but do not contain voting instructions will be voted: •FOR Item 1: the election of our 13 Director nominees. •FOR Item 2: the advisory vote to approve the compensation of our named executive officers. •FOR Item 3: the ratification of the appointment of PricewaterhouseCoopers LLP as our independent registered public accounting firm. •AGAINST Items 4-5: the shareholder proposals. •In the best judgment of the named proxy holders if any other matters are properly brought before the Annual Meeting.
| | | | Revoking your proxy or changing your vote | |
Registered shareholders can change your proxy vote or revoke your proxy at any time before the Annual Meeting by: •Returning a signed proxy card with a later date. •Authorizing a new vote electronically through the internet or telephone. •Delivering a written revocation of your proxy to the Office of the Corporate Secretary at our principal office address before your original proxy is voted at the Annual Meeting. •Submitting a ballot virtually at the Annual Meeting. Beneficial shareholders can submit new voting instructions by following specific directions provided by your bank, broker or other holder of record. You can also vote during the Annual Meeting if you obtain a legal proxy from your bank, broker or other holder of record. Your personal attendance at the virtual Annual Meeting does not revoke your proxy. Unless you vote at the Annual Meeting, your last valid proxy prior to or at the Annual Meeting will be used to cast your vote. | | | | Johnson & Johnson employee savings plans | |
If you hold shares in a Johnson & Johnson employee savings plan, you will receive one proxy card or Notice that covers the shares held for you in your savings plan, as well as any other shares registered directly in your name (but not shares held beneficially through a bank, broker or other holder of record). If you submit voting instructions for the plan shares via the internet, by telephone or by mail, as described above, by 5:00 p.m. Eastern Time on April 23, 2024, the Trustee of your savings plan will vote your shares as you have directed. Your voting instructions will be kept confidential. It is important that you direct the Trustee how to vote your shares. In accordance with the terms of your respective Johnson & Johnson savings plan, you are the named fiduciary for shares held in your savings plan and have the right to direct the Trustee with respect to those shares. If you do not direct the plan Trustee how to vote your shares, the Trustee will vote your shares in direct proportion to the votes cast for all shares held in that plan for which voting instructions were provided by other plan shareholders if the voted shares are at five percent (5%) or above of allocated shares. If the voted shares in that plan are less than five percent (5%) of allocated shares, the Trustee may vote any undirected shares at its discretion. Participants in a Johnson & Johnson employee savings plan may attend the Annual Meeting of Shareholders. However, shares held in those plans can only be voted as described herein and cannot be voted at the Annual Meeting. If your valid proxy is timely received by Internet, telephone, or mail, the persons designated as proxies will vote your shares per your directions. We have designated twoIn addition to the solicitation of proxies by mail, several regular employees of the Johnson & Johnson family of companies may solicit proxies in person or by telephone. We have also retained the firm of Morrow Sodali LLC to aid in the solicitation of banks, brokers and institutional and other shareholders for a fee of approximately $20,000, plus reimbursement of expenses. We will bear all costs of the solicitation of proxies. Any registered shareholder voting by proxy card may substitute the name of another person in place of the persons presently named as proxies. In order to vote, a substitute proxy must present adequate identification to a representative of the Office of our executive officers as proxies for the 2018 Annual Meeting of Shareholders – D. J. Caruso and M. H. Ullmann. Should any other matter not referred to in this Proxy Statement properly come before the meeting, the designated proxies will vote in their discretion. If any Director nominee should refuse or be unable to serve, an event that is not anticipated, your shares will be voted for the person designated by the Board of Directors to replace such nominee or, alternatively, the Board of Directors may reduce the number of Directors on the Board.
| | | Effect of Not Casting Your Vote | Registered Shareholders: When a valid proxy is received, but specific choices are not indicated, the designated proxies will vote as recommended by the Board of Directors.
Beneficial Shareholders: It is critical that you cast your vote if you want it to count in the election of Directors and most other items on the agenda. Under applicable regulations, if you hold your shares beneficially and do not instruct your bank, broker or other holder of record on how to vote your shares, the holder of record will only have discretion to vote your uninstructed shares on the ratification of the appointment of our independent registered public accounting firm (Item 3). The holder of record will not have discretion to vote your uninstructed shares on the election of directors (Item 1), the advisory vote to approve named executive officer compensation (Item 2), or the shareholder proposals (Items 4 and 5), resulting in “broker non-votes” on those items.
| | | Revoking Your Proxy
or Changing Your Vote
| You may change your vote at any time before your proxy is exercised.
Registered Shareholders:
• If you voted by mail: you may revoke your proxy at any time before it is exercised by executing and delivering a timely and valid later-dated proxy, by voting by ballot at the meeting or by giving written notice to the Corporate Secretary.
• If you voted via the Internet or by telephone: you may change your vote with a timely and valid later Internet or telephone vote, or by voting by ballot at the meeting.
• Attendance at the meeting will not have the effect of revoking a proxy unless (1) you give proper written notice of revocation to the Corporate Secretary before the proxy is exercised, or (2) you vote by ballot at the meeting.
Beneficial Shareholders: Follow the specific directions provided by your bank, broker or other holder of record to change or revoke any voting instructions you have already provided. Beneficial holders who have already voted may not change their vote at the meeting.
| | | | Reduce duplicate mailings | |
| | | | | | 2018 Proxy Statement - 95
|
| | | | | Johnson & Johnson Employee Savings Plans | If you hold shares in a Johnson & Johnson company employee savings plan, you will receive one proxy card or Notice that covers the shares held for you in your savings plan, as well as any other shares registered directly in your name (but not shares held beneficially through a bank, broker or other holder of record). If you vote the plan shares via the Internet, by telephone or by mail, as described above, by 5:00 p.m. (Eastern) on April 24, 2018, the Trustee of your savings plan will vote your shares as you have directed (your voting instructions will be kept confidential). It is important that you direct the Trustee how to vote yourWe have adopted a procedure approved by the SEC called “householding." Under this procedure, registered shareholders who have the same address and last name and who receive either notices or paper copies of the proxy materials in the mail will receive only one copy of our proxy materials, or a single envelope containing the notices, for all shareholders at that address. This consolidated method of delivery continues until one or more of these shareholders notifies us that they would like to receive individual copies of proxy materials. This procedure reduces our printing costs and postage fees. Shareholders who participate in householding continue to receive separate proxy cards or notices for voting their shares. In accordance with the terms of the Johnson & Johnson Savings Plan and the Johnson & Johnson Puerto Rico Retirement Savings Plan, you are the named fiduciary for shares held in your savings plan and have the right to direct the Trustee with respect to those shares. If you do not direct the plan Trustee how to vote your shares, the Trustee will vote your shares in direct proportion to the votes cast for all shares held in that plan for which voting instructions were provided by other plan holders.
Participants in the Johnson & Johnson employee savings plans may attend the Annual Meeting. However, shares held in those plans can only be voted as described in this paragraph and cannot be voted at the meeting.
| | | Annual Meeting Attendance | If you were a shareholder as of the record date, February 27, 2018, and plan to attend our Annual Meeting in person, please note:
• Venue: Hyatt Regency New Brunswick, Two Albany Street, New Brunswick, New Jersey.
• Time: The doors to the meeting will open at 9:15 a.m. and the meeting will begin at 10:00 a.m. The anticipated running time of the meeting will be approximately one hour.
• Parking: Limited parking will be available at the Hyatt Regency New Brunswick, and other parking facilities will be open to self-parkers at normal hourly and daily rates. For information on local parking go to: www.njnbpa.org.
• Devices: Cameras (including cell phones with photographic capabilities), recording devices and other electronic devices will not be permitted at the meeting.
• Tickets: See “Admission Ticket Procedures” below.
(Note: Consistent with our practice in recent years, we do not provide product bags or food at the meeting.)
| | | Admission Ticket Procedures | Tickets to the meeting will be available to shareholders as of the record date, February 27, 2018.
If you were a shareholder as of the record date, and you plan to attend the Annual Meeting in person, you must print your own ticket and bring it to the meeting to gain access.
• Tickets can be printed by clicking on the “Register for Meeting” button found at www.proxyvote.com/JNJ and following the instructions provided. You will need the 16-digit control number included on your Notice, proxy card or vote instruction form.
• If you are unable to print your ticket, please call Shareholder Meeting Registration Phone Support (toll free) at 1-844-318-0137 or (international toll call) at 1-925-331-6070, or email AnnualMeeting@its.jnj.com for assistance.
• On the day of the meeting, you will be required to present valid picture identification, such as a driver’s license or passport, with your admission ticket. You may be denied entrance if the required identification is not presented.
Guest tickets are not available. Exceptions may be granted to shareholders who require a companion ticket in order to facilitate their own attendance (for example, due to a physical disability) by contacting Shareholder Meeting Registration Phone Support per the instructions above.
|
| | | | 2018 Proxy Statement - 96
| | |
| | | | | Proxy Solicitation | In addition to the solicitation of proxies by mail, several regular employees of the Johnson & Johnson Family of Companies may solicit proxies in person or by telephone. We have also retained the firm of Morrow & Co., LLC to aid in the solicitation of banks, brokers, and institutional and other shareholders for a fee of approximately $20,000, plus reimbursement of expenses. We will bear all costs of the solicitation of proxies. Any registered shareholder voting by proxy card may substitute the name of another person in place of the persons presently named as proxies. In order to vote, a substitute proxy must present adequate identification to the Corporate Secretary. | | | Electronic Access to Proxy Materials | This Proxy Statement and our 2017 Annual Report are available at www.investor.jnj.com/gov/annualmeetingmaterials.cfm. If you received paper copies of this year’s Proxy Statement and Annual Report by mail, you can elect to receive an e-mail message in the future that will provide a link to those documents and voting instructions on the Internet. By opting to access your proxy materials via the Internet, you will:Registered shareholders who wish to discontinue householding and receive separate copies of proxy materials may notify Computershare by calling (800) 328-9033 or may send a written request to the Office of the Corporate Secretary at the address of our principal office.
Beneficial shareholders may request information about householding from your bank, broker or other holder of record. • gain faster access to your proxy materials; | | | | Electronic access to proxy materials | |
This Proxy Statement and our 2023 Annual Report are available at www.investor.jnj.com/asm. If you received paper copies of this year’s Proxy Statement and Annual Report by mail, you can elect to receive an e-mail message in the future that will provide a link to those documents and voting instructions on the internet. By opting to access your proxy materials via the internet, you will: •Gain faster access to your proxy materials. •Help save on our production and mailing costs. •Reduce the amount of paper mail you receive. •Help preserve environmental resources. If you have enrolled in the electronic access service previously, you will continue to receive your proxy materials by e-mail unless and until you elect an alternative method of delivery. Registered shareholders may enroll in the electronic proxy and Annual Report access service for future Annual Meetings of Shareholders by registering at www.computershare-na.com/green. If you vote via the internet, simply follow the prompts that link you to that website. Beneficial shareholders who wish to enroll for electronic access may register at enroll.icsdelivery.com/jnj, or by following instructions for e-delivery from your broker or other holder of record. • help save on our production and mailing costs;
• reduce the amount of paper mail you receive; and
• help preserve environmental resources.
If you have enrolled in the electronic access service previously, you will continue to receive your proxy materials by e-mail, unless and until you elect an alternative method of delivery.
Registered Shareholders may enroll in the electronic proxy and Annual Report access service for future Annual Meetings of Shareholders by registering at www.computershare-na.com/green. If you vote via the Internet, simply follow the prompts that link you to that website.
Beneficial Shareholders who wish to enroll for electronic access may register at enroll.icsdelivery.com/jnj, or by following instructions for e-delivery from your broker or other holder of record.
| | | Reduce Duplicate Mailings
| We have adopted a procedure approved by the SEC called “householding," Under this procedure, registered shareholders who have the same address and last name and who receive either Notices or paper copies of the proxy materials in the mail will receive only one copy of our proxy materials, or a single envelope containing the Notices, for all shareholders at that address. This consolidated method of delivery continues until one or more of these shareholders notifies us that they would like to receive individual copies of proxy materials. This procedure reduces our printing costs and postage fees. Shareholders who participate in householding continue to receive separate proxy cards or Notices for voting their shares.
Registered Shareholders who wish to discontinue householding and receive separate copies of proxy materials may notify Computershare by calling (800) 328-9033, or send a written request to the Office of the Corporate Secretary at the address of our principal office.
Beneficial Shareholders may request information about householding from your bank, broker or other holder of record.
| | | Corporate Governance Materials | Shareholders can see our Restated Certificate of Incorporation; By-Laws; Principles of Corporate Governance; Board Committee Charters; Code of Business Conduct for employees; Code of Business Conduct & Ethics for Members of the Board of Directors and Executive Officers; and other corporate governance materials at www.investor.jnj.com/gov.cfm. Copies of these documents, as well as additional copies of this Proxy Statement and 2017 Annual Report, are available to shareholders, without charge, upon request to the Corporate Secretary at our principal office address.
| | | | Notice to investors concerning forward-looking statements | |
| | | | | | 2018 Proxy Statement - 97
|
| | | | | | | Shareholder Proposals, Director Nominations by Shareholders and Other Items of Business | Rule 14a-8: To be included in the Proxy Statement and proxy card for the 2018 Annual Meeting of Shareholders, a shareholder proposal must be received at our principal office on or before November 14, 2018 and must comply with Rule 14a-8 under the U.S. Securities and Exchange Act of 1934, as amended.
Proxy Access: As discussed on page 27 of this Proxy Statement, in 2016 we amended our By-Laws to implement proxy access, which allows a shareholder or a group of up to 20 shareholders owning shares representing at least 3% of the common stock of the company continuously for at least three years, to nominate and include in our Proxy Statement their own Director nominee(s) constituting up to 20% of the total number of Directors then serving on the Board (with a minimum of up to two Director nominees if the Board size is less than 10), provided that the shareholder(s) and the nominee(s) satisfy the requirements in our By-Laws.Notice of Director nominees for the 2019 Annual Meeting of Shareholders must include the information required under our By-Laws and must be received by our Corporate Secretary at our principal office no earlier than the close of business (5:00 p.m. Eastern Time) on October 15, 2018 and no later than the close of business on November 14, 2018, unless the date of the 2019 Annual Meeting of Shareholders has been changed by more than 30 calendar days. In that case, such notice must be received by our Corporate Secretary no earlier than the close of business on the 90th calendar day before the date we commence mailing of our proxy materials in connection with the 2019 Annual Meeting of Shareholders and no later than the close of business on the later of (i) the 60th calendar day before the date we commence mailing of our proxy materials in connection with the 2019 Annual Meeting of Shareholders or (ii) the 10th calendar day following the day on which public announcement of the date of the 2019 Annual Meeting of Shareholders is first made.
Advance Notice Provisions: In addition, under the terms of our By-Laws, a shareholder who intends to present an item of business (including a Director nomination) at the 2019 Annual Meeting of Shareholders (other than a proposal submitted or a Director candidate nominated for inclusion in our proxy materials) must provide us with written notice of such business at our principal office, including the information specified in the By-Laws, which must be received during the same windows as those described above under “Proxy Access.”
Proposals and other items of business should be directed to the attention of the Office of the Corporate Secretary at the address of our principal office: One Johnson & Johnson Plaza, New Brunswick, New Jersey 08933.
| | | | Contacting Our Board, Individual Directors and Committees
| You can contact any of our Directors, including our Lead Director, by writing to them c/o Johnson & Johnson, Office of the Corporate Secretary, One Johnson & Johnson Plaza, New Brunswick, NJ 08933. Employees and others who wish to contact the Board or any member of the Audit Committee to report any complaint or concern with respect to accounting, internal accounting controls or auditing matters, may do so anonymously by using the address above. You can also use the on-line submission forms on our website to contact the Board and the Audit Committee. Our process for handling communications to the Board or the individual Directors has been approved by the independent Directors and can be found at www.investor.jnj.com/communication.cfm.
| | | | Helpful Websites | Company | www.jnj.com | | Investor Relations | www.investor.jnj.com | | Corporate Governance | www.investor.jnj.com/gov.cfm | | Annual Meeting Materials | www.investor.jnj.com/gov/annualmeetingmaterials.cfm | | Board of Directors | www.investor.jnj.com/gov.cfm | | Certificate of Incorporation and By-Laws | www.investor.jnj.com/gov/cdocument.cfm | | Contact the Board | www.investor.jnj.com/communication.cfm | | Political Contributions | www.investor.jnj.com/gov/contributions.cfm | | SEC Filings | www.investor.jnj.com/sec.cfm |
This Proxy Statement contains “forward-looking statements” as defined in the Private Securities Litigation Reform Act of 1995. The reader is cautioned not to rely on these forward-looking statements. These statements are based on current expectations of future events. If underlying assumptions prove inaccurate or known or unknown risks or uncertainties materialize, actual results could vary materially from the expectations and projections of Johnson & Johnson. Risks and uncertainties include, but are not limited to: economic factors, such as interest rate and currency exchange rate fluctuations; competition, including technological advances, new products and patents attained by competitors; challenges inherent in new product research and development, including uncertainty of clinical success and obtaining regulatory approvals; uncertainty of commercial success for new and existing products; challenges to patents; the impact of patent expirations; the ability of the Company to successfully execute strategic plans, including restructuring plans; the impact of business combinations and divestitures; manufacturing difficulties or delays, internally or within the supply chain; product efficacy or safety concerns resulting in product recalls or regulatory action; significant adverse litigation or government action, including related to product liability claims; changes to applicable laws and regulations, including tax laws and global healthcare reforms; trends toward healthcare cost containment; changes in behavior and spending patterns of purchasers of healthcare products and services; financial instability of international economies and legal systems and sovereign risk; increased scrutiny of the healthcare industry by government agencies; the potential failure to meet obligations in compliance agreements with government bodies; the Company’s ability to realize the anticipated benefits from the separation of Kenvue Inc.; and Kenvue Inc.'s ability to succeed as a standalone publicly traded company. A further list and descriptions of these risks, uncertainties and other factors can be found in Johnson & Johnson’s Annual Report on Form 10-K for the fiscal year ended December 31, 2023, including in the sections captioned “Cautionary Note Regarding Forward-Looking Statements” and “Item 1A. Risk Factors,” and in Johnson & Johnson’s subsequent Quarterly Reports on Form 10-Q and other filings with the Securities and Exchange Commission. Copies of these filings are available online at www.sec.gov, www.jnj.com or on request from Johnson & Johnson. Any forward-looking statement made in this Proxy Statement speaks only as of the date of this Proxy Statement. Johnson & Johnson does not undertake to update any forward-looking statement as a result of new information or future events or developments.
| | | | 2018 Proxy Statement - 98
| | |
| | | | Contacting the Board, individual Directors and committees | |
You can contact any of the Directors, including the Lead Director, by writing to them c/o Johnson & Johnson, Office of the Corporate Secretary, One Johnson & Johnson Plaza, New Brunswick, NJ 08933. Employees and others who wish to contact the Board or any member of the Audit Committee to submit good faith complaints regarding fiscal improprieties, internal accounting controls, accounting or auditing matters, may do so anonymously by using the address above. You can also use the on-line submission forms on our website to contact the Board and the Audit Committee. Our process for handling communications to the Board or the individual Directors has been approved by the independent Directors and can be found at www.investor.jnj.com/governance/corporate-governance-overview.  | | | | Shareholder proposals, director nominations by shareholders and other items of business | |
Address to submit a shareholder proposal or director nomination: Proposals and other items of business should be directed to the attention of the Office of the Corporate Secretary at the address of our principal office: One Johnson & Johnson Plaza, New Brunswick, New Jersey 08933. | | | | | | | | | | Type of proposal | Deadline | Submission requirements | Shareholder Proposal
| | Our Credo
We believeTo be included in our first responsibility is to the doctors, nurses and patients, to mothers and fathers and all others who use our products and services. In meeting their needs everything we do must be of high quality. We must constantly strive to reduce our costs in order to maintain reasonable prices. Customers’ orders must be serviced promptly and accurately. Our suppliers and distributors must have an opportunity to make a fair profit.
We are responsible to our employees, the men and women who work with us throughout the world. Everyone must be considered as an individual. We must respect their dignity and recognize their merit. They must have a sense of security in their jobs. Compensation must be fair and adequate, and working conditions clean, orderly and safe. We must be mindful of ways to help our employees fulfill their family responsibilities. Employees must feel free to make suggestions and complaints. There must be equal opportunity for employment, development and advancement for those qualified. We must provide competent management, and their actions must be just and ethical.
We are responsible to the communities in which we live and work and to the world community as well. We must be good citizens –support good works and charities and bear our fair share of taxes. We must encourage civic improvements and better health and education. We must maintain in good order the property we are privileged to use, protecting the environment and natural resources.
Our final responsibility is to our stockholders. Business must make a sound profit. We must experiment with new ideas. Research must be carried on, innovative programs developed and mistakes paid for. New equipment must be purchased, new facilities provided and new products launched. Reserves must be created to provide for adverse times. When we operate according to these principles, the stockholders should realize a fair return.
| |
 Notice of 2018 Annual Meeting
and Proxy Statement
Important Notice Regarding the Availability of Proxy Materials for the Annual Meeting:
The Notice and Proxy Statement and proxy card for the 2025 Annual Report are available at www.proxyvote.com/JNJ.Meeting of Shareholders
| November 13, 2024 | Must comply with Rule 14a-8 under the U.S. Securities and Exchange Act of 1934, as amended
| Proxy Access Nominee
Shareholder nomination of a Director to be included in our Proxy Statement and proxy card for the 2025 Annual Meeting of Shareholders pursuant to our proxy access By-Law
| Between October 14, 2024 and November 13, 2024 | Must include the information specified under our By-Laws | Advance Notice Provisions for Item of Business
Business proposal not intended to be included in our Proxy Statement and proxy card for the 2025 Annual Meeting of Shareholders
| Between October 14, 2024 and November 13, 2024 | Must include the information specified under our By-Laws | Advance Notice Provisions for Director Nominee — — — — — — — — — — — — — — — — — — — — — — — — — — — — — — — — — — — — — — — — — — — — — — — — — — — — — — — — — — — — — — — — — — — — — — — — — — — —Shareholder nomination of a Director not pursuant to our proxy access By-Law
| Between October 14, 2024 and November 13, 2024, with any additional information required by Rule 14a-19 of the Exchange Act due by February 24, 2025 | Must include the information specified under our By-Laws and as required by Rule 14a-19 |
Our By-Laws can be found at www.investor.jnj.com/governance/corporate-governance-overview.
| | | | Corporate governance materials | |
The Company’s main corporate website address is www.jnj.com. This Proxy Statement, the 2023 Annual Report and all of the Company’s other SEC filings are also available on the Company’s website atwww.investor.jnj.com/financials/sec-filings/ as soon as reasonably practicable after having been electronically filed or furnished to the SEC. All SEC filings are also available at the SEC’s website at www.sec.gov. Investors and the public should note that the Company also announces information at www.factsaboutourprescriptionopioids.com, www.factsabouttalc.comand www.LLTmanagementinformation.com. We use these websites to communicate with investors and the public about our products, litigation and other matters. It is possible that the information we post to these websites could be deemed to be material information. Therefore, we encourage investors and others interested in the Company to review the information posted to these websites in conjunction with www.jnj.com, the Company's SEC filings, press releases, public conference calls and webcasts. In addition, the Restated Certificate of Incorporation, as amended, By-Laws, the written charters of the Audit Committee, the Compensation & Benefits Committee, the Nominating & Corporate Governance Committee, the Regulatory Compliance & Sustainability Committee and the Science & Technology Committee of the Board of Directors and the Company’s Principles of Corporate Governance, Code of Business Conduct (for employees), Code of Business Conduct & Ethics for Members of the Board of Directors and Executive Officers and other corporate governance materials are available on the Company's website at www.investor.jnj.com/corporate-governance and will be provided without charge to any shareholder submitting a written request, as provided above. The information on www.jnj.com, www.factsaboutourprescriptionopioids.com, www.factsabouttalc.com and www.LLTmanagementinformation.comis not, and will not be deemed, a part of this Proxy Statement or incorporated into any other filings the Company makes with the SEC. | | | | | | | Helpful websites | | Company | www.jnj.com | | Annual Meeting materials | www.investor.jnj.com/asm | | Board of Directors | www.investor.jnj.com/governance/corporate-governance-overview | | Certificate of Incorporation and By-Laws | www.investor.jnj.com/governance/corporate-governance-overview | | Contact the Board | www.investor.jnj.com/governance/corporate-governance-overview | | Corporate governance | www.investor.jnj.com/governance/corporate-governance-overview | | Diversity, Equity & Inclusion Impact Review | belong.jnj.com/ | | Enterprise Business Review | jnjbusinessreview.q4ir.com/ | | ERM Framework | www.jnj.com/about-jnj/enterprise-risk-management-framework | | ESG resources | www.jnj.com/esg-resources | | Health for Humanity Report | healthforhumanityreport.jnj.com | | Investor relations | www.investor.jnj.com | | Janssen U.S. Transparency Report | transparencyreport.janssen.com | | Opioids | www.factsaboutourprescriptionopioids.com | | Political engagement | www.investor.jnj.com/political-engagement | | SEC filings | www.investor.jnj.com/financials/sec-filings | | Talc | www.factsabouttalc.com; www.LLTmanagementinformation.com |
| | | | | | | | | | | | | | | | | | | | | | | Proxy – Johnson & Johnson | | | | | Notice of 2018 Annual Meeting of Shareholders
Hyatt Regency New Brunswick
Two Albany Street, New Brunswick, NJ 08901
Proxy Solicited by the Board of Directors for Annual Meeting – April 26, 2018 at 10:00 a.m., Eastern Time
The signatory hereto hereby appoints D. J. Caruso and M. H. Ullmann and each or either of them as proxies, with full power of substitution and revocation, to represent the signatory hereto and to vote all shares of common stock of Johnson & Johnson that the signatory hereto is entitled to vote at the Annual Meeting of Shareholders of the company to be held on April 26, 2018 at 10:00 a.m., Eastern Time, at the Hyatt Regency New Brunswick, Two Albany Street, New Brunswick, New Jersey, upon the matters listed on the reverse side hereof and, in their discretion, upon such other matters as may properly come before the meeting and any adjournments or postponements thereof.
Holders of Shares in Johnson & Johnson Employee Savings Plans: If you hold shares in a Johnson & Johnson company employee savings plan, this Proxy covers those shares held for you in your savings plan, as well as any other shares registered in your name. By signing and returning this Proxy (or voting by telephone or the Internet), you will authorize the Trustee of your savings plan to vote your savings plan shares as you have directed.
Shares represented by this Proxy will be voted as directed by the shareholder. If this Proxy is signed, the proxies have authority and intend to vote as follows regarding any nominee or matter for which no directions are indicated: FOR election of all Director nominees, FOR Items 2 and 3, and AGAINST Items 4 and 5.
| | | | | | | | Address Changes/Comments: | | | | | | | | | | | | | | | | | | | | | | | | | | | | | | | | | | | (If you noted any address changes/comments above, please mark corresponding box on the reverse side.)
Continued and to be signed on reverse side
| | | |
 | | | | | | | | VOTE BY INTERNET - www.proxyvote.com/JNJ
Use the Internet to transmit your voting instructions up until 11:59 p.m. Eastern Time on April 25, 2018 or up until 5:00 p.m. Eastern Time on April 24, 2018 for shares held in a Johnson & Johnson company employee savings plan. Have your proxy card in hand when you access the website and follow the instructions to obtain your proxy materials and to create an electronic voting instruction form.
ELECTRONIC DELIVERY OF FUTURE PROXY MATERIALS
If you would like to reduce the costs incurred by our company in mailing proxy materials, you can consent to receiving all future proxy statements, proxy cards and annual reports electronically via e-mail or the Internet. To sign up for electronic delivery, please follow the instructions above to vote using the Internet and, when prompted, indicate that you agree to receive or access proxy materials electronically in future years.
VOTE BY TELEPHONE - 1-800-690-6903
Use any touch-tone telephone to transmit your voting instructions up until 11:59 p.m. Eastern Time on April 25, 2018 (or up until 5:00 p.m. Eastern Time on April 24, 2018 for shares held in a Johnson & Johnson company employee savings plan). Have your proxy card in hand when you call and then follow the instructions.
VOTE BY MAIL
Mark, sign and date your proxy card and return it in the postage-paid envelope we have provided or return it to Vote Processing, c/o Broadridge, 51 Mercedes Way, Edgewood, NY 11717.
SHAREHOLDER MEETING TICKET REQUEST
You must register for and print your ticket on the shareholder meeting registration site: www.proxyvote.com/JNJ. If you are unable to print your ticket, please call Shareholder Meeting Registration Phone Support (Toll Free) 1-844-318-0137 or (International Toll Call) 1-925-331-6070 or email AnnualMeeting@its.jnj.com for assistance.
| | | JOHNSON & JOHNSON
ONE JOHNSON & JOHNSON PLAZA
NEW BRUNSWICK, NJ 08933
| | | | | | | | | | | | | | | | | |
TO VOTE, MARK BLOCKS BELOW IN BLUE OR BLACK INK AS FOLLOWS:
M99745-P72096-Z67022 KEEP THIS PORTION FOR YOUR RECORDS
— — — — — — — — — — — — — — — — — — — — — — — — — — — — — — — — — — — — — — — — — — — — — — — — — — — — — — — — — — — — — — — — — — — — — — — — — — — —
| | | | | | | | | | | | | | | | | | | | | | | | | | | | THIS PROXY CARD IS VALID ONLY WHEN SIGNED AND DATED. | | DETACH AND RETURN THIS PORTION ONLY | | | | | | | | | | | | | | | | | | | | | | | | | | | JOHNSON & JOHNSON | | | | | | | | | | | | | | | | | | | | | | | | | | | | | | | | | | | | | | | | | | | | | | The Board of Directors recommends a vote FOR
all Director nominees listed:
| | | | | | | | | | | | | | | | | | | | | | | | | | | 1. | | Election of Directors | | For | | Against | | Abstain | | | The Board of Directors recommends a vote FOR the following proposals:
| | | | For | | Against | | Abstain | | | | | | | | | | | | | | | | | | | | | | | | | 1a. | | Mary C. Beckerle | | ¨
| | ¨
| | ¨
| | | 2. | | Advisory Vote to Approve Named Executive Officer Compensation | | ¨
| | ¨
| | ¨
| | | | | | | | | | | | | | | | | | | | | | | | | 1b. | | D. Scott Davis | | ¨
| | ¨
| | ¨
| | | 3. | | Ratification of Appointment of PricewaterhouseCoopers LLP as the Independent Registered Public Accounting Firm for 2018 | | ¨
| | ¨
| | ¨
| | | | | | | | | | | | | | | | | | | | | | | | | | | | 1c. | | Ian E. L. Davis | | ¨
| | ¨
| | ¨
| | | The Board of Directors recommends a vote
AGAINST the following proposals:
| | | | | | | | | | | | | | | | | | | | | | | | | | | | | | | | | | | | | 1d. | | Jennifer A. Doudna | | ¨
| | ¨
| | ¨
| | | 4. | | Shareholder Proposal – Accounting for Litigation and Compliance in Executive Compensation Performance Measures | | | | ¨
| | ¨
| | ¨
| | | | | | | | | | ¨ | | | | | | | | | | | | | | | | | | | 1e. | | Alex Gorsky | | ¨
| | ¨
| | ¨
| | | 5. | | Shareholder Proposal – Amendment to Shareholder Ability to Call Special Shareholder Meeting | | | | ¨
| | ¨
| | ¨
| | | | | | | | | | | | | | | | | | | | | | | | | | | | 1f. | | Mark B. McClellan | | ¨
| | ¨
| | ¨
| | | | | | | | | | | | | | | | | | | | | | | | | | | | | | | | | | | | | | | | | 1g. | | Anne M. Mulcahy | | ¨
| | ¨
| | ¨
| | | | | | | | | | | | | | | | | | | | | | | | | | | | | | | | | | | | | | | | | 1h. | | William D. Perez | | ¨
| | ¨
| | ¨
| | | | | | | | | | | | | | | | | | | | | | | | | | | | | | | | | | | | | | | | | 1i. | | Charles Prince | | ¨
| | ¨
| | ¨
| | | | | | | | | | | | | | | | | | | | | | | | | | | | | | | | | | | | | | | | | 1j. | | A. Eugene Washington | | ¨
| | ¨
| | ¨
| | | | | | | | | | | | | | | | | | | | | | | | | | | | | | | | | | | | | | | | | 1k. | | Ronald A. Williams | | ¨
| | ¨
| | ¨
| | | | | | | | | | | | | | | | | | | | | | | | | | | | | | | | | | | | | | | | | | | | | | | | | | | | | | | | | | | | | | | | | | | | | | | | | | | | | | | | | | | | | | For address changes and/or comments, please check this box and complete where indicated on reverse side. | | | ¨
| | | | | | | | | | | | | | | | | | | | | | | | | | | | | | | | | | | | | Please sign exactly as name(s) appear(s) hereon. Joint owners should each sign. When signing as attorney, executor, administrator, corporate officer, trustee, guardian, or custodian, please provide full title. | | | | | | | | | | | | | | | | | | | | | | | | Signature [PLEASE SIGN WITHIN BOX] | | Date | | | Signature (Joint Owners) | | Date | | | | | | | |
|
|
|
|
|